Listing Analyzer Overview: Benchmarking & Content Strategy

Olivia Reyes
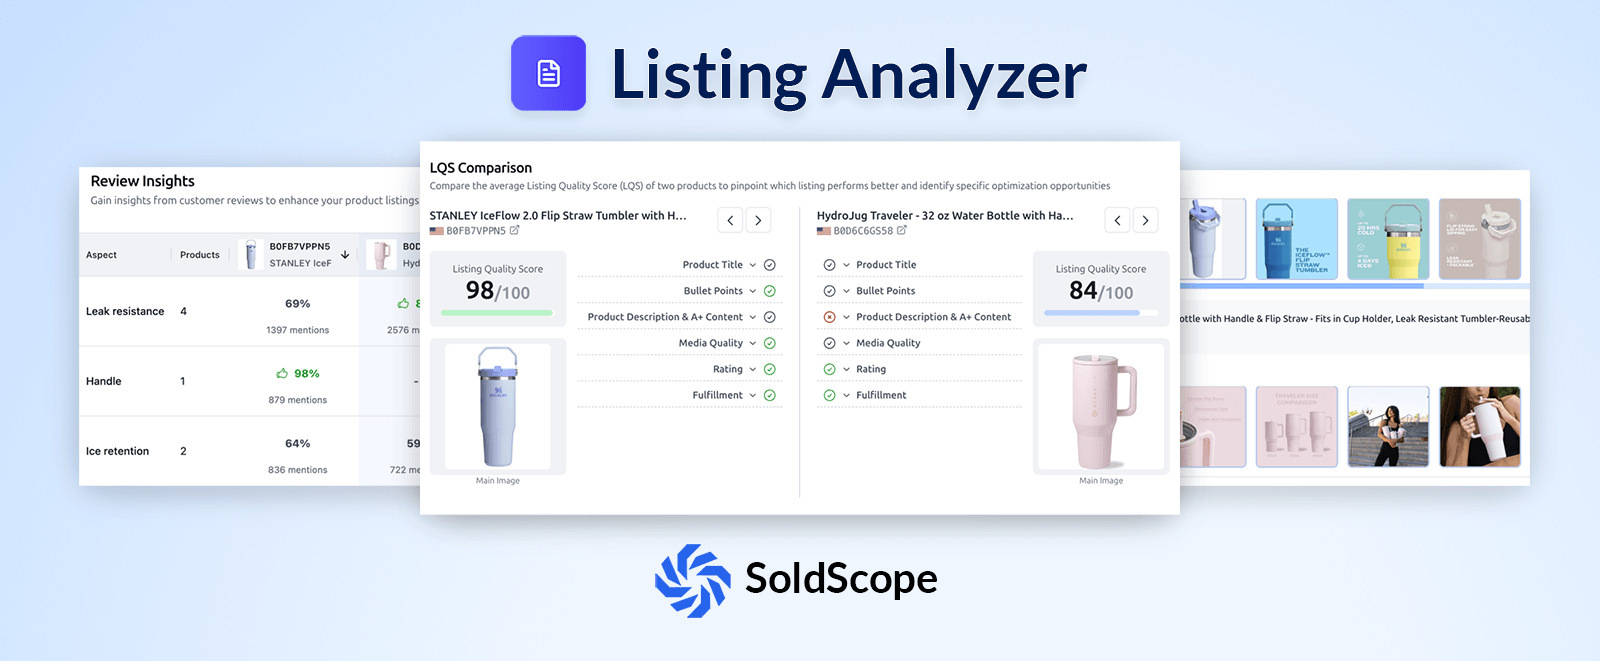
The Listing Analyzer is your primary tool for competitive benchmarking. It allows you to tear down your own listing alongside up to 10 competitors to see exactly where you are winning and where your content is falling short.
By using a data-driven approach, you can stop guessing what makes a "good" listing and start following the specific patterns that lead to higher conversion rates.
1. Starting Your Analysis
To begin, navigate to the Listing Analyzer from the main menu. You have three ways to populate your search:
Manual Entry: Enter your Main ASIN and up to 10 Competitor ASINs.
Get Competitors: Enter your ASIN and let SoldScope automatically identify your top rivals.
Insert from Bright List: Import a pre-saved list of products from your keyword research projects.
2. The Results: Five Pillars of Analysis
Once you click Analyze Listing, SoldScope generates a comprehensive report broken into five distinct blocks:
I. Products & LQS (Listing Quality Score)
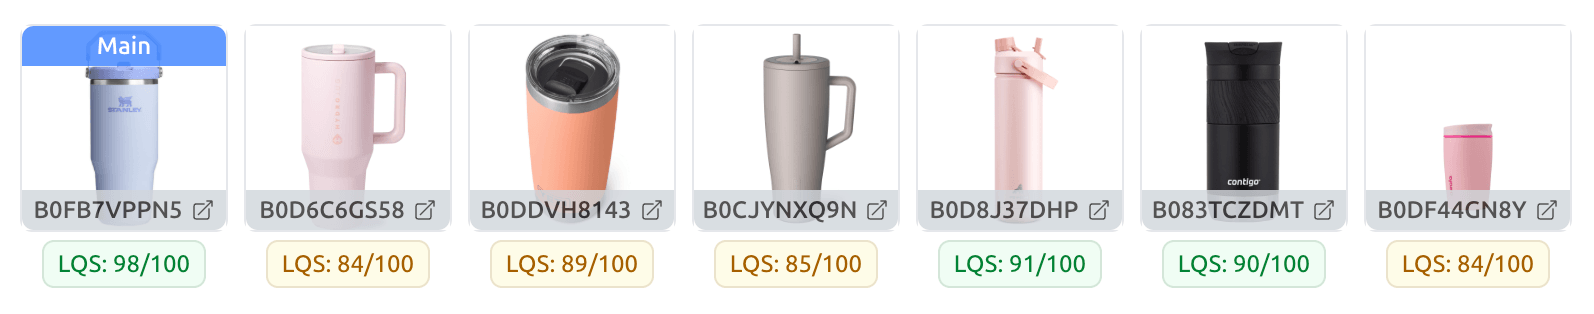
The top section gives you an instant "health check." Every product is assigned an LQS (Listing Quality Score) out of 100.
Green Score (90+): Excellent optimization.
Yellow/Orange Score (<85): Significant room for improvement.
II. LQS Comparison (Side-by-Side Audit)
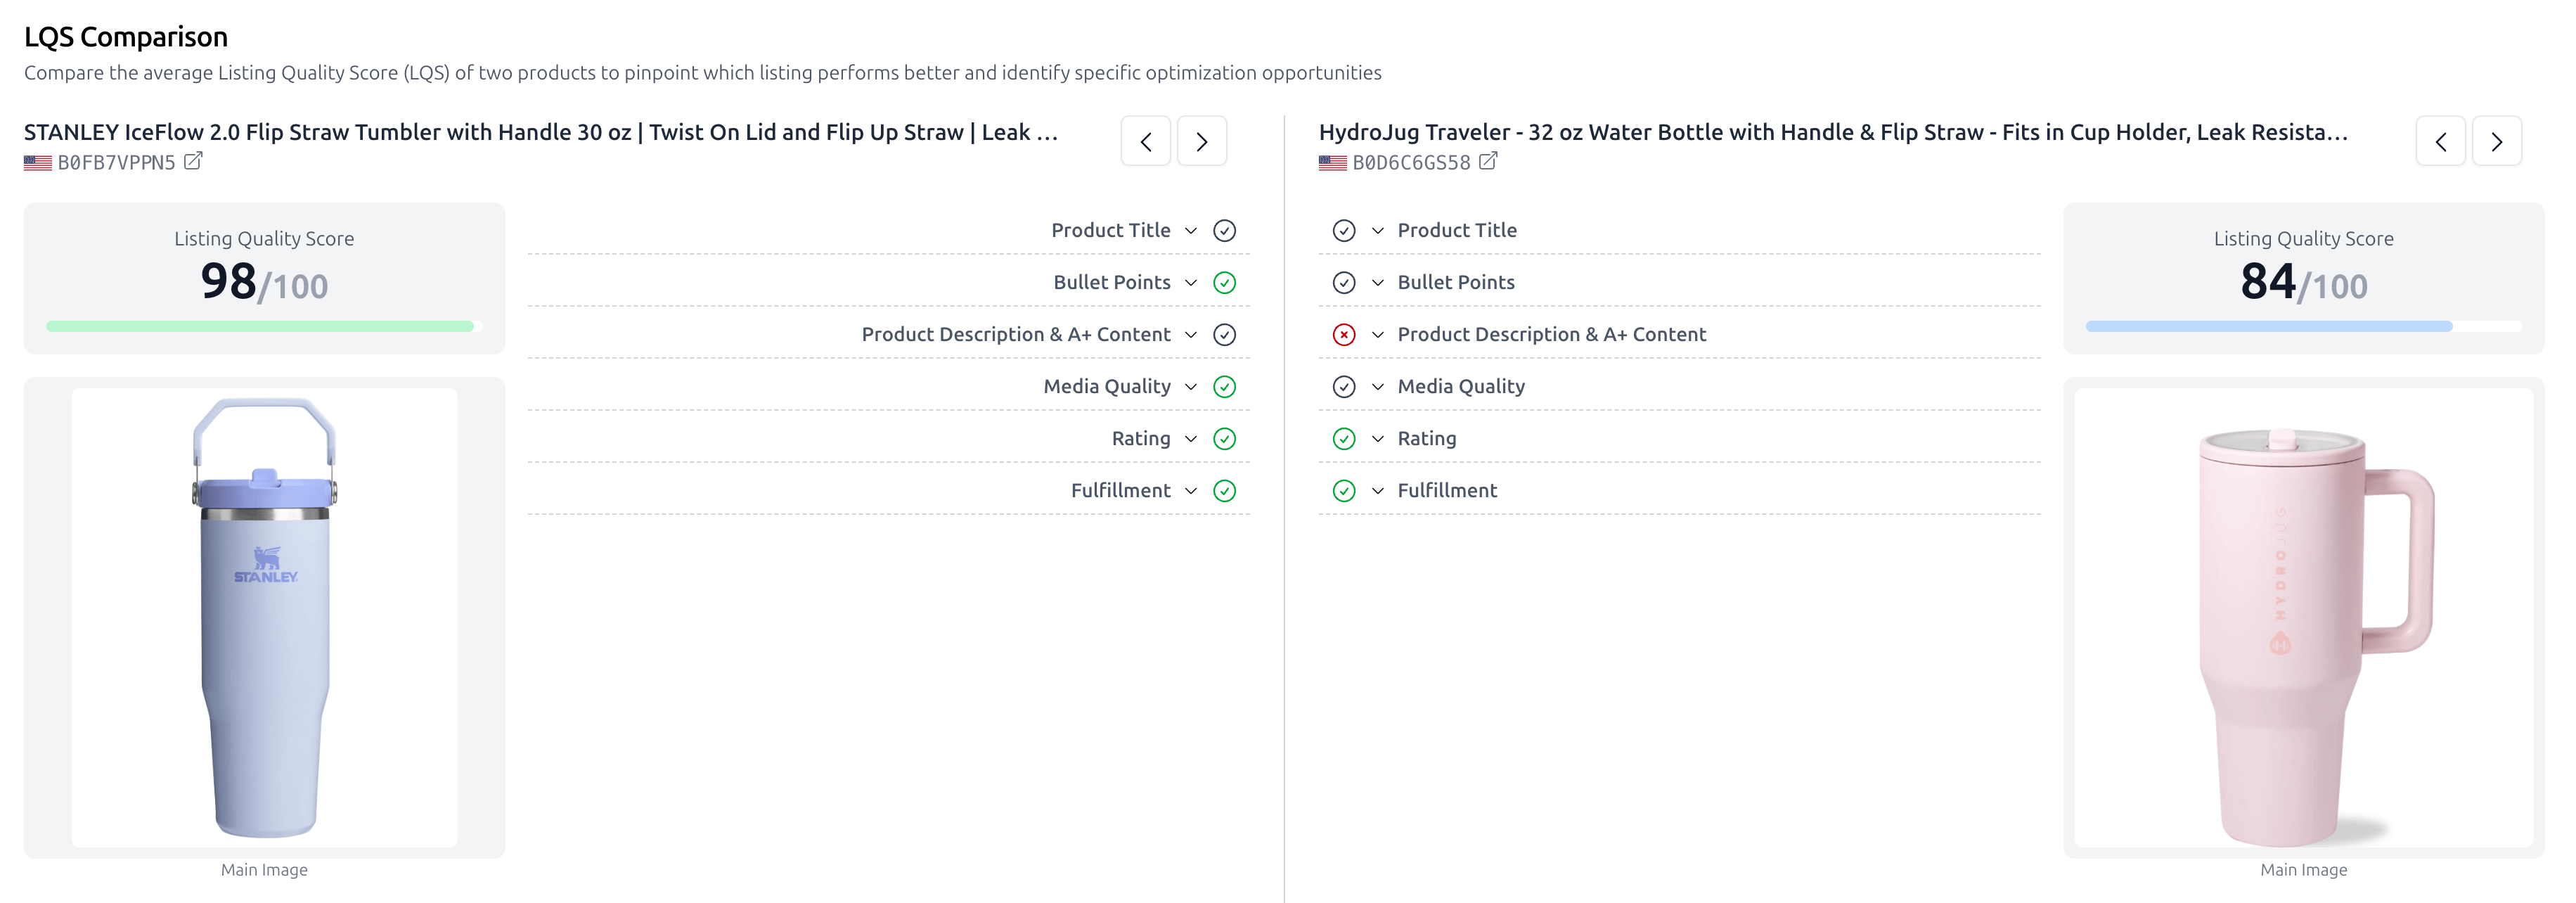
This is where you find your "to-do" list. You can select any two products to compare their content quality side-by-side. The tool audits:
Copywriting: Checks Title, Bullet Points, and A+ Content/Description.
Media & Meta: Evaluates Media Quality, Star Ratings, and Fulfillment method (FBA vs. FBM).
Tip: Look for Red Circles in your column compared to Green Checks in your competitor's column to prioritize your next update.
III. Product Snapshot
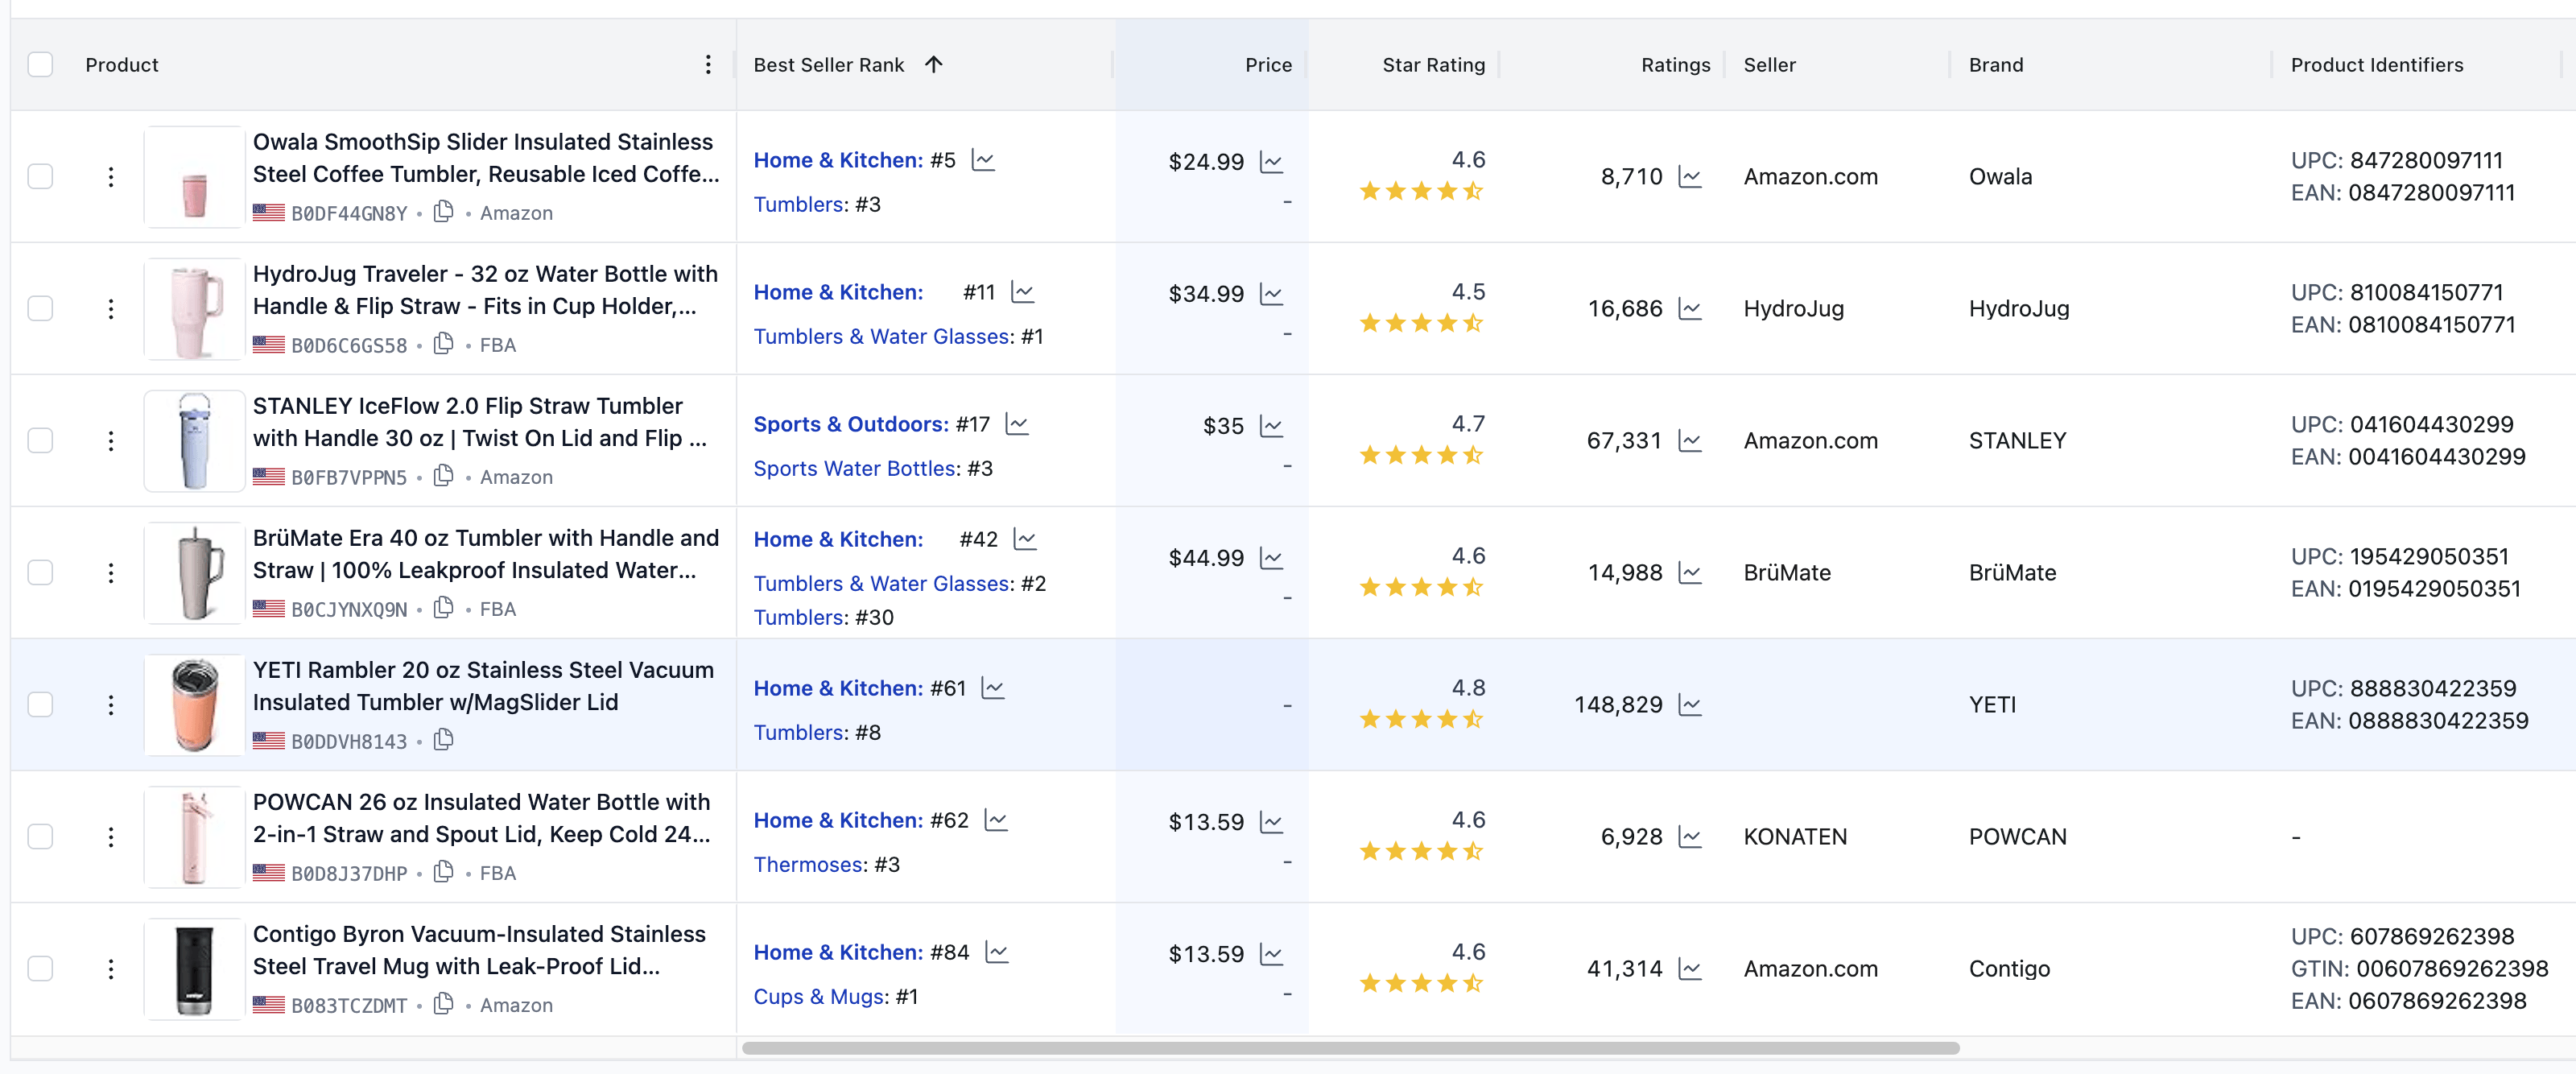
This block provides a concise table of core business data for all analyzed products. It allows you to compare:
Best Seller Rank (BSR): See how the category rank correlates with price and ratings.
Seller Information: Identify if you are competing against Amazon.com directly or international sellers.
Price & Social Proof: Compare price points against total rating counts to judge listing "authority".
IV. Media Comparison
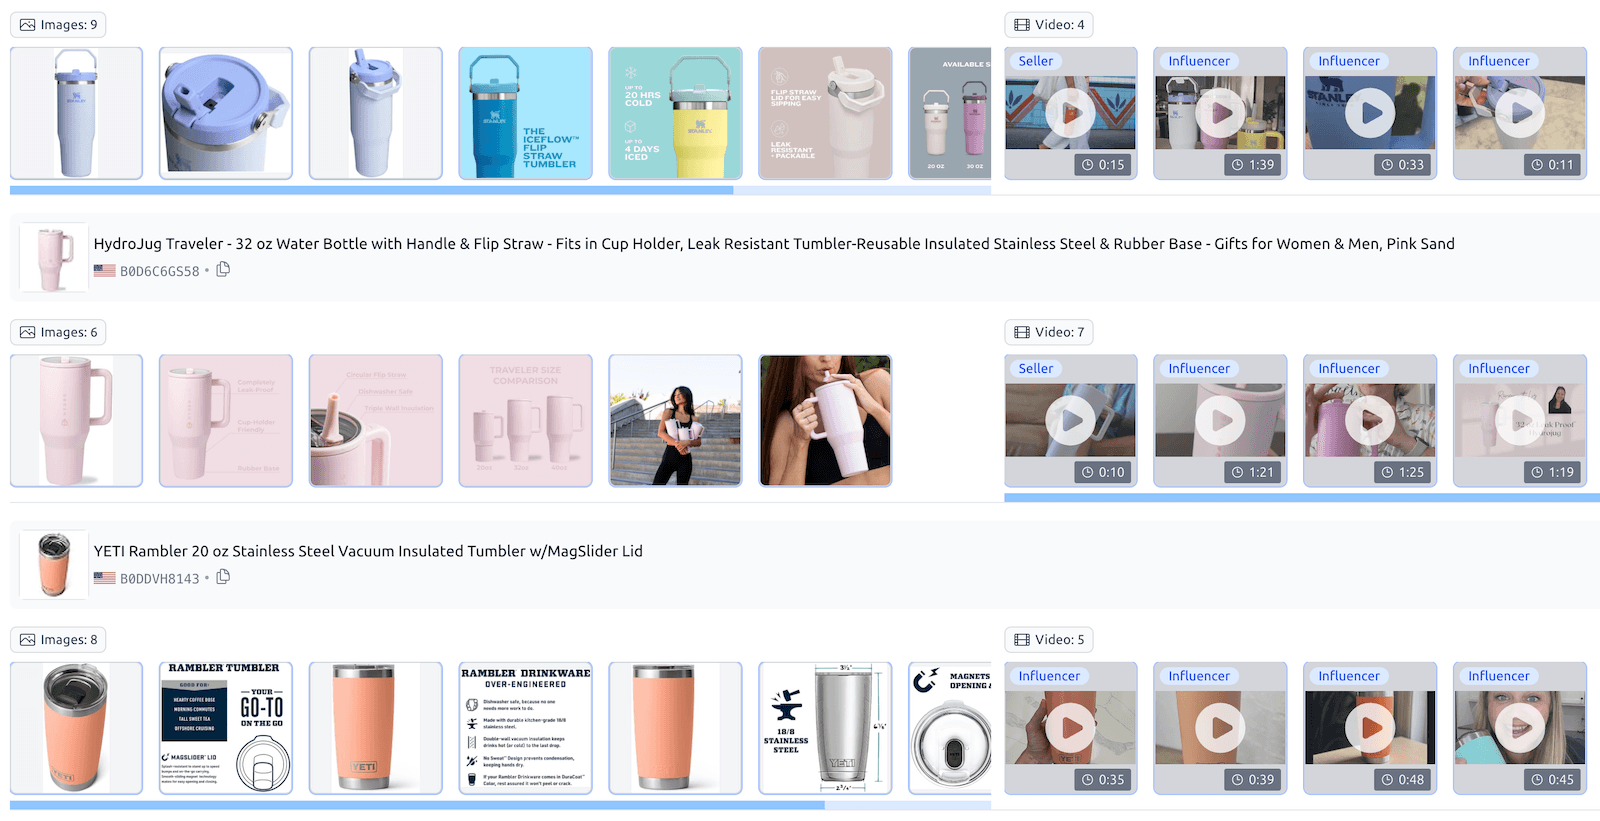
Visuals are the biggest driver of conversion. This section displays every image and video for each product in your list.
Image Count: See if your competitors are using all 7-9 available slots.
Video Strategy: Identify which competitors are using Influencer Videos versus Seller-produced content to build trust.
V. Review Insights
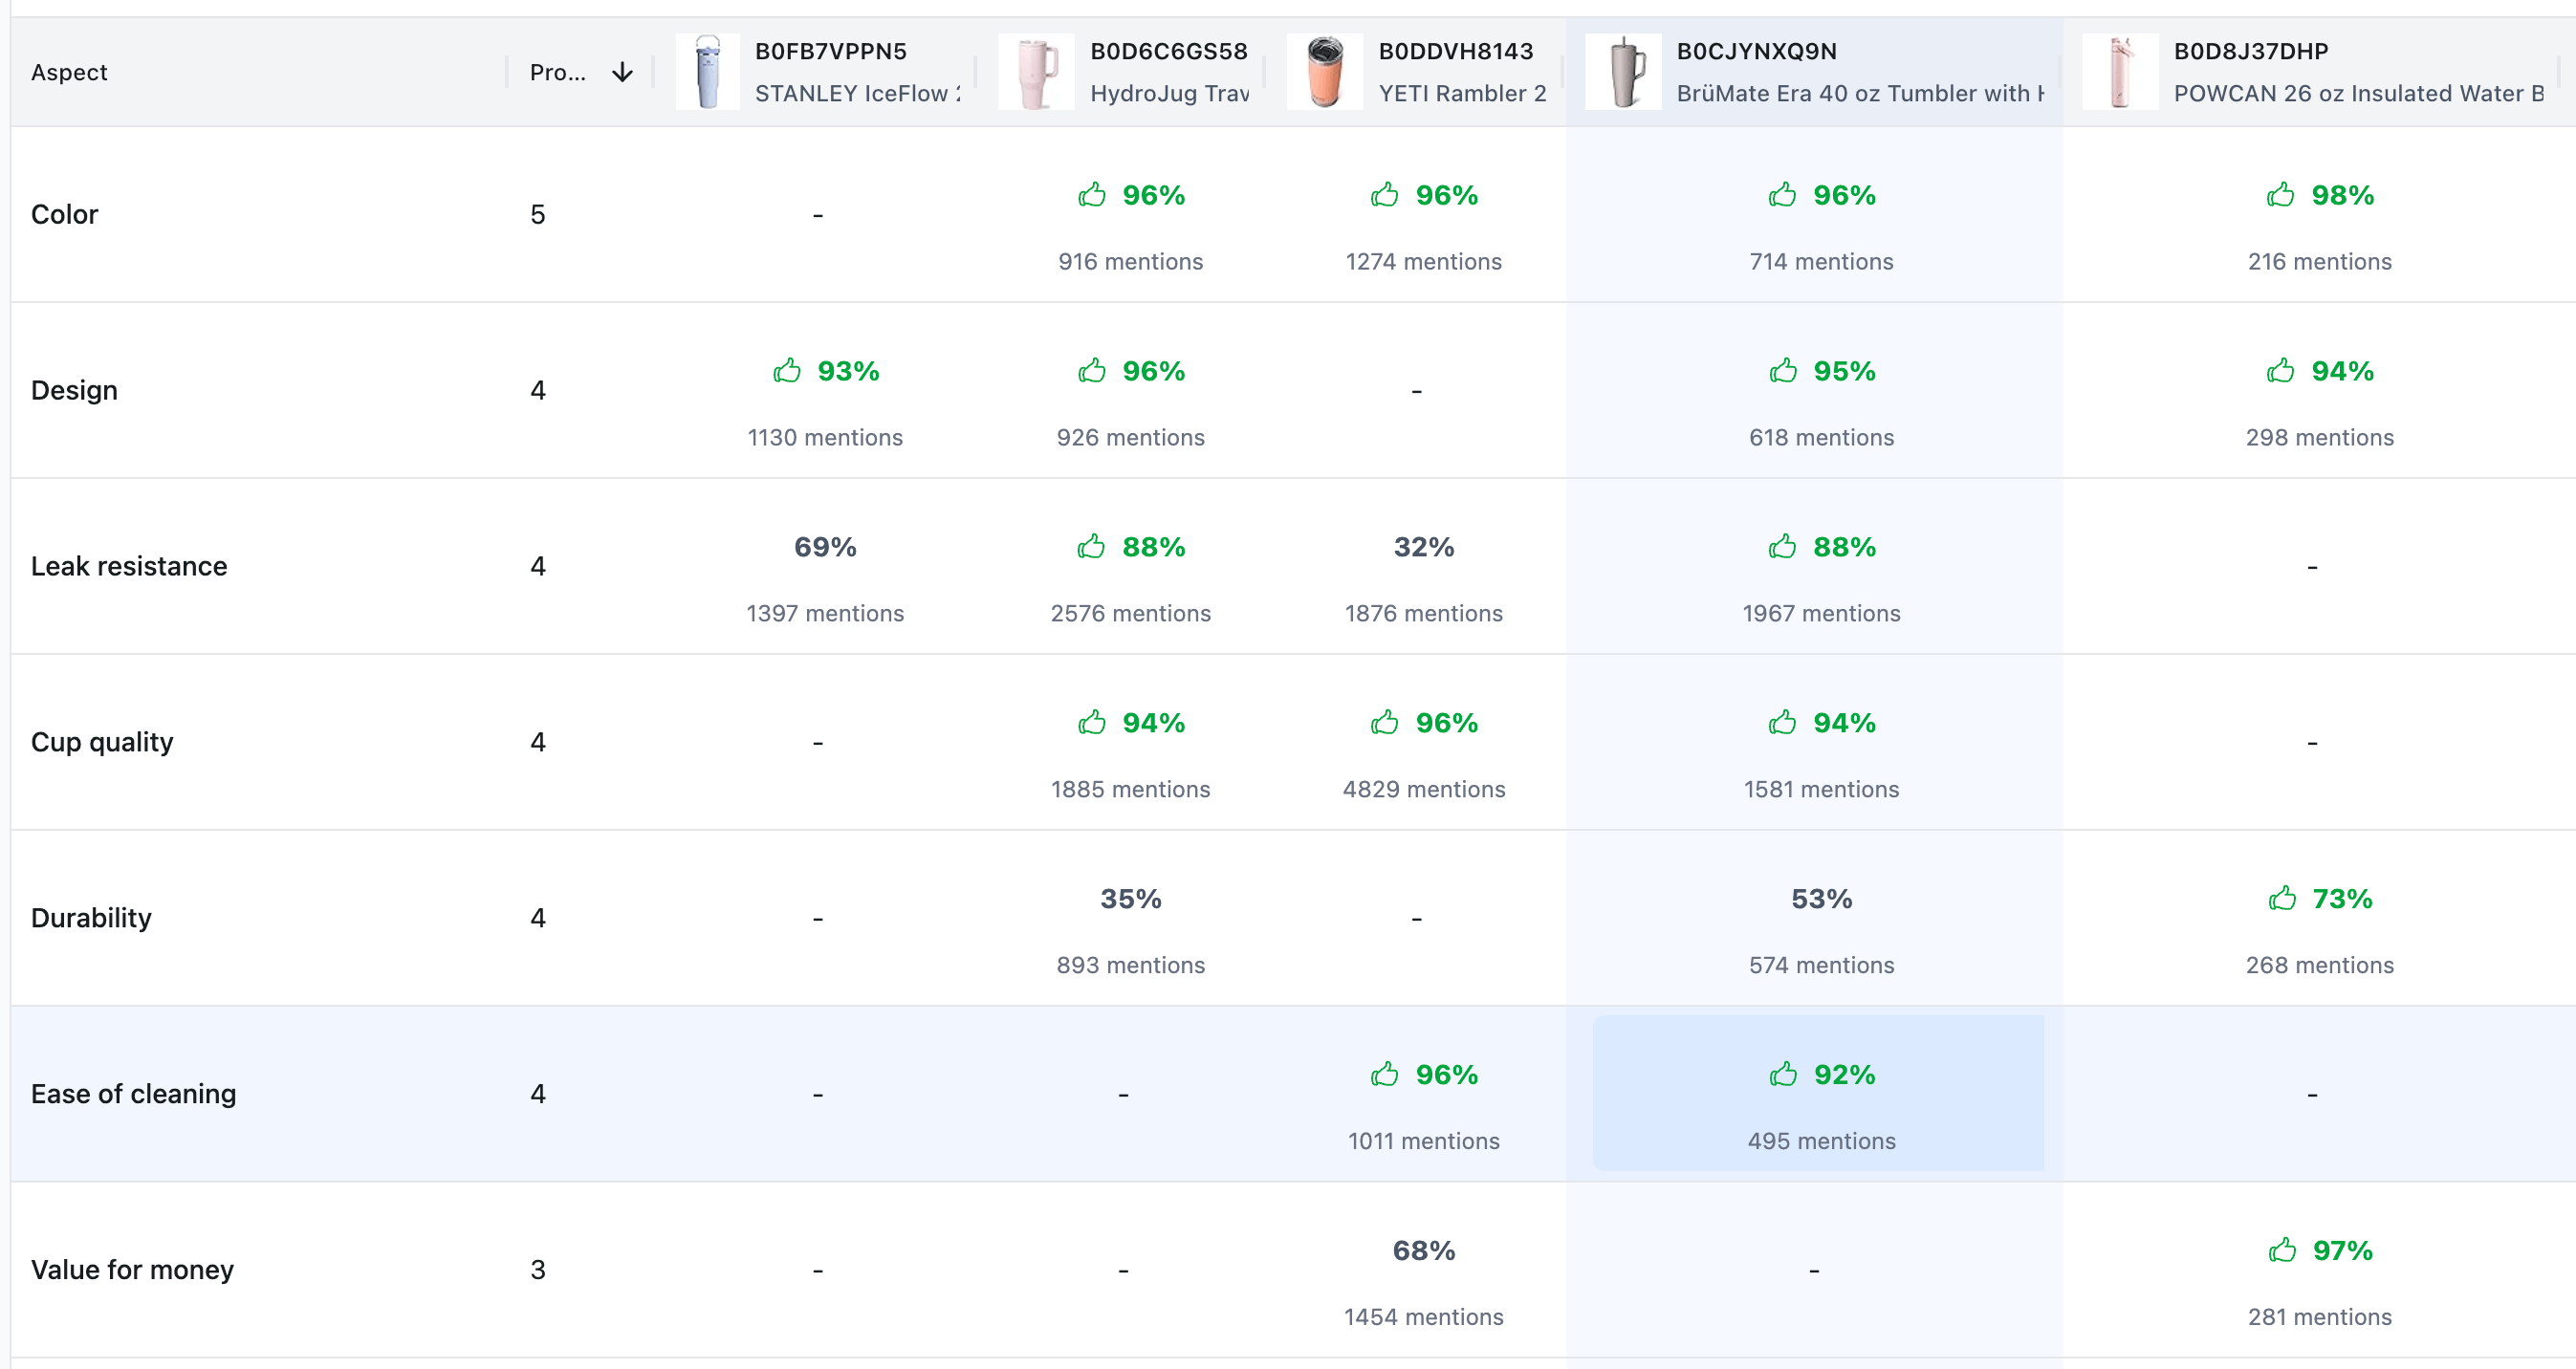
Instead of reading thousands of individual reviews, this table aggregates the core "Aspects" shoppers care about.
Source: This data is pulled from Amazon's AI-generated review summaries found on product pages.
Sentiment Analysis: You can see percentage ratings and mention counts for categories like Leak Resistance, Durability, or Value for Money.
Strategy: Use this to identify a competitor's weakness (e.g., a 35% rating for Durability) and highlight your product's strength in that exact area within your bullet points.
Summary
Use the Listing Analyzer to turn competitor strengths into your new content strategy. If a rival has a higher LQS and better Review Insights, use their listing as a template for your own optimization.
Would you like me to draft the next article for the Listing Optimization series, or should we move on to the video script for the Listing Analyzer?