Analyzing Keyword Research Results (Matrix View)

Olivia Reyes
While the Keyword Table View is perfect for deep diving into data, the Matrix View is designed for strategy.
By toggling the "Matrix View" switch in the toolbar, you transform the list into a comparative grid. This allows you to see exactly how your product stacks up against up to 20 competitors simultaneously, covering both listing quality and keyword rankings.
1. The Product Attribute Grid (Top Section)
The top part of the Matrix is a "Tale of the Tape." It compares the physical and historical attributes of every selected ASIN side-by-side.
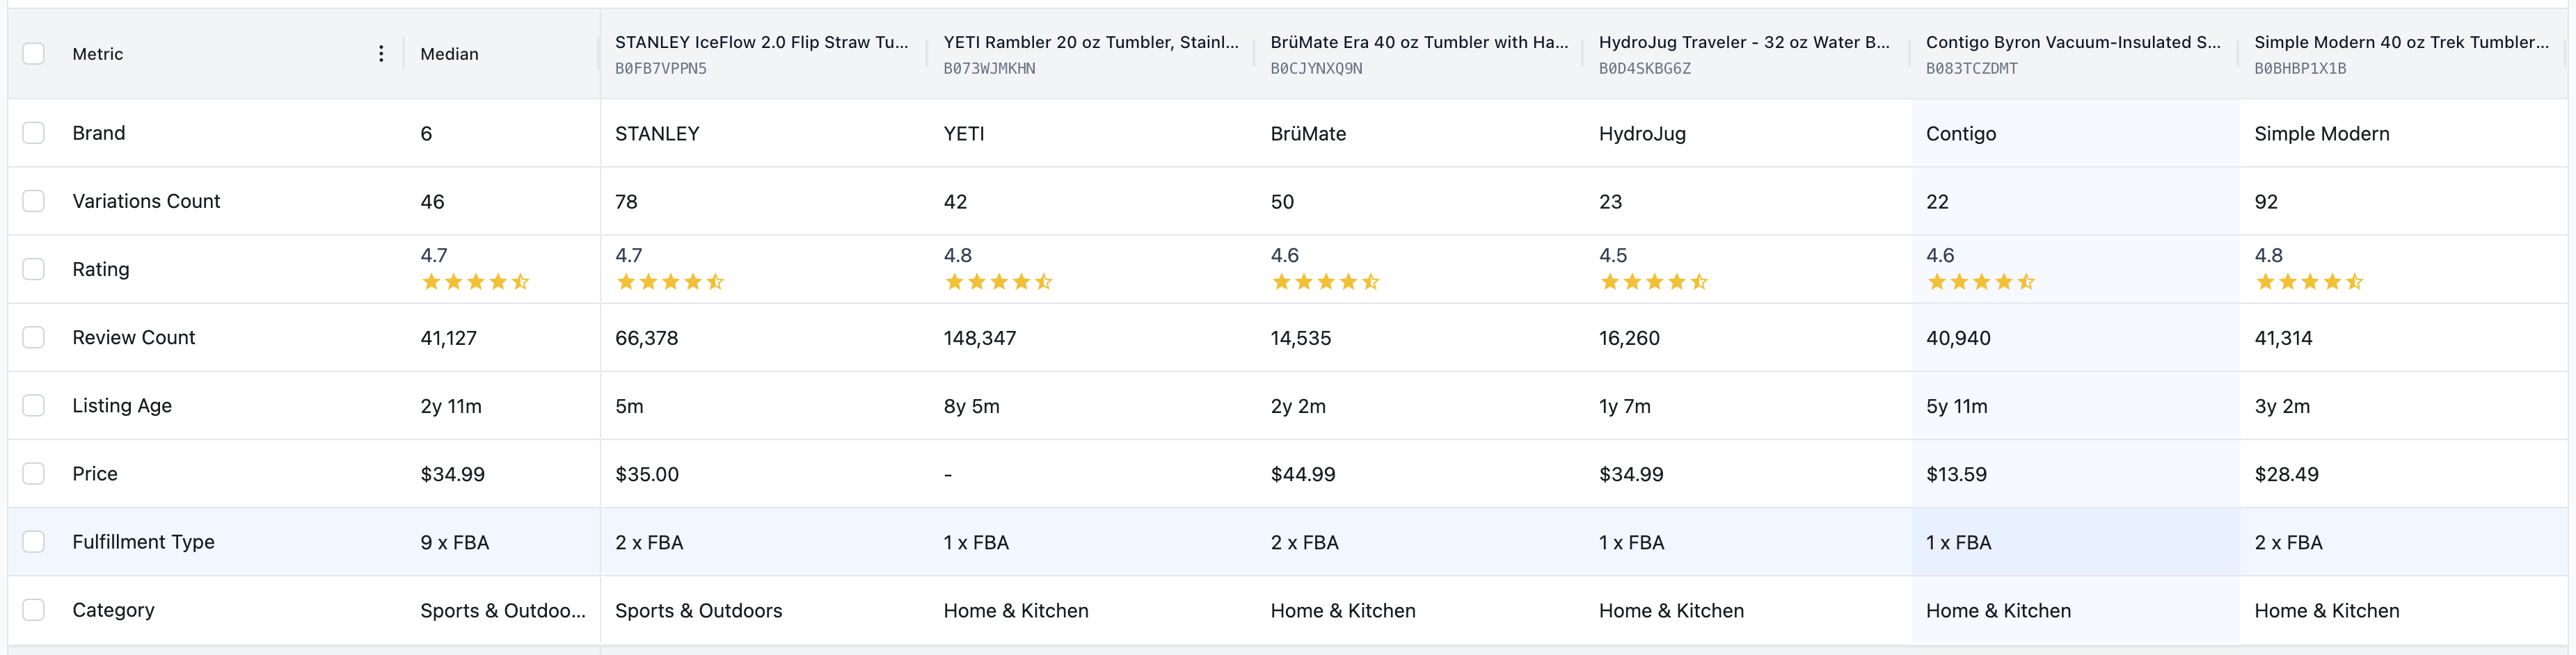
This is critical for benchmarking. Before you wonder why a competitor is outranking you, check these rows:
Listing Age: Is this a legacy product (3+ years old) or a new launch?
Price: How does your price compare to the pack?
Review Count & Rating: Are you fighting a competitor with 100,000 reviews?
Fulfillment Type: See if competitors are FBA or FBM.
Variations Count: How many style options do they offer?
The Median Column: The first data column is labeled "Median". This calculates the middle value for the entire group, giving you an instant baseline for what is "normal" in this niche.
2. The Keyword Ranking Grid (Bottom Section)
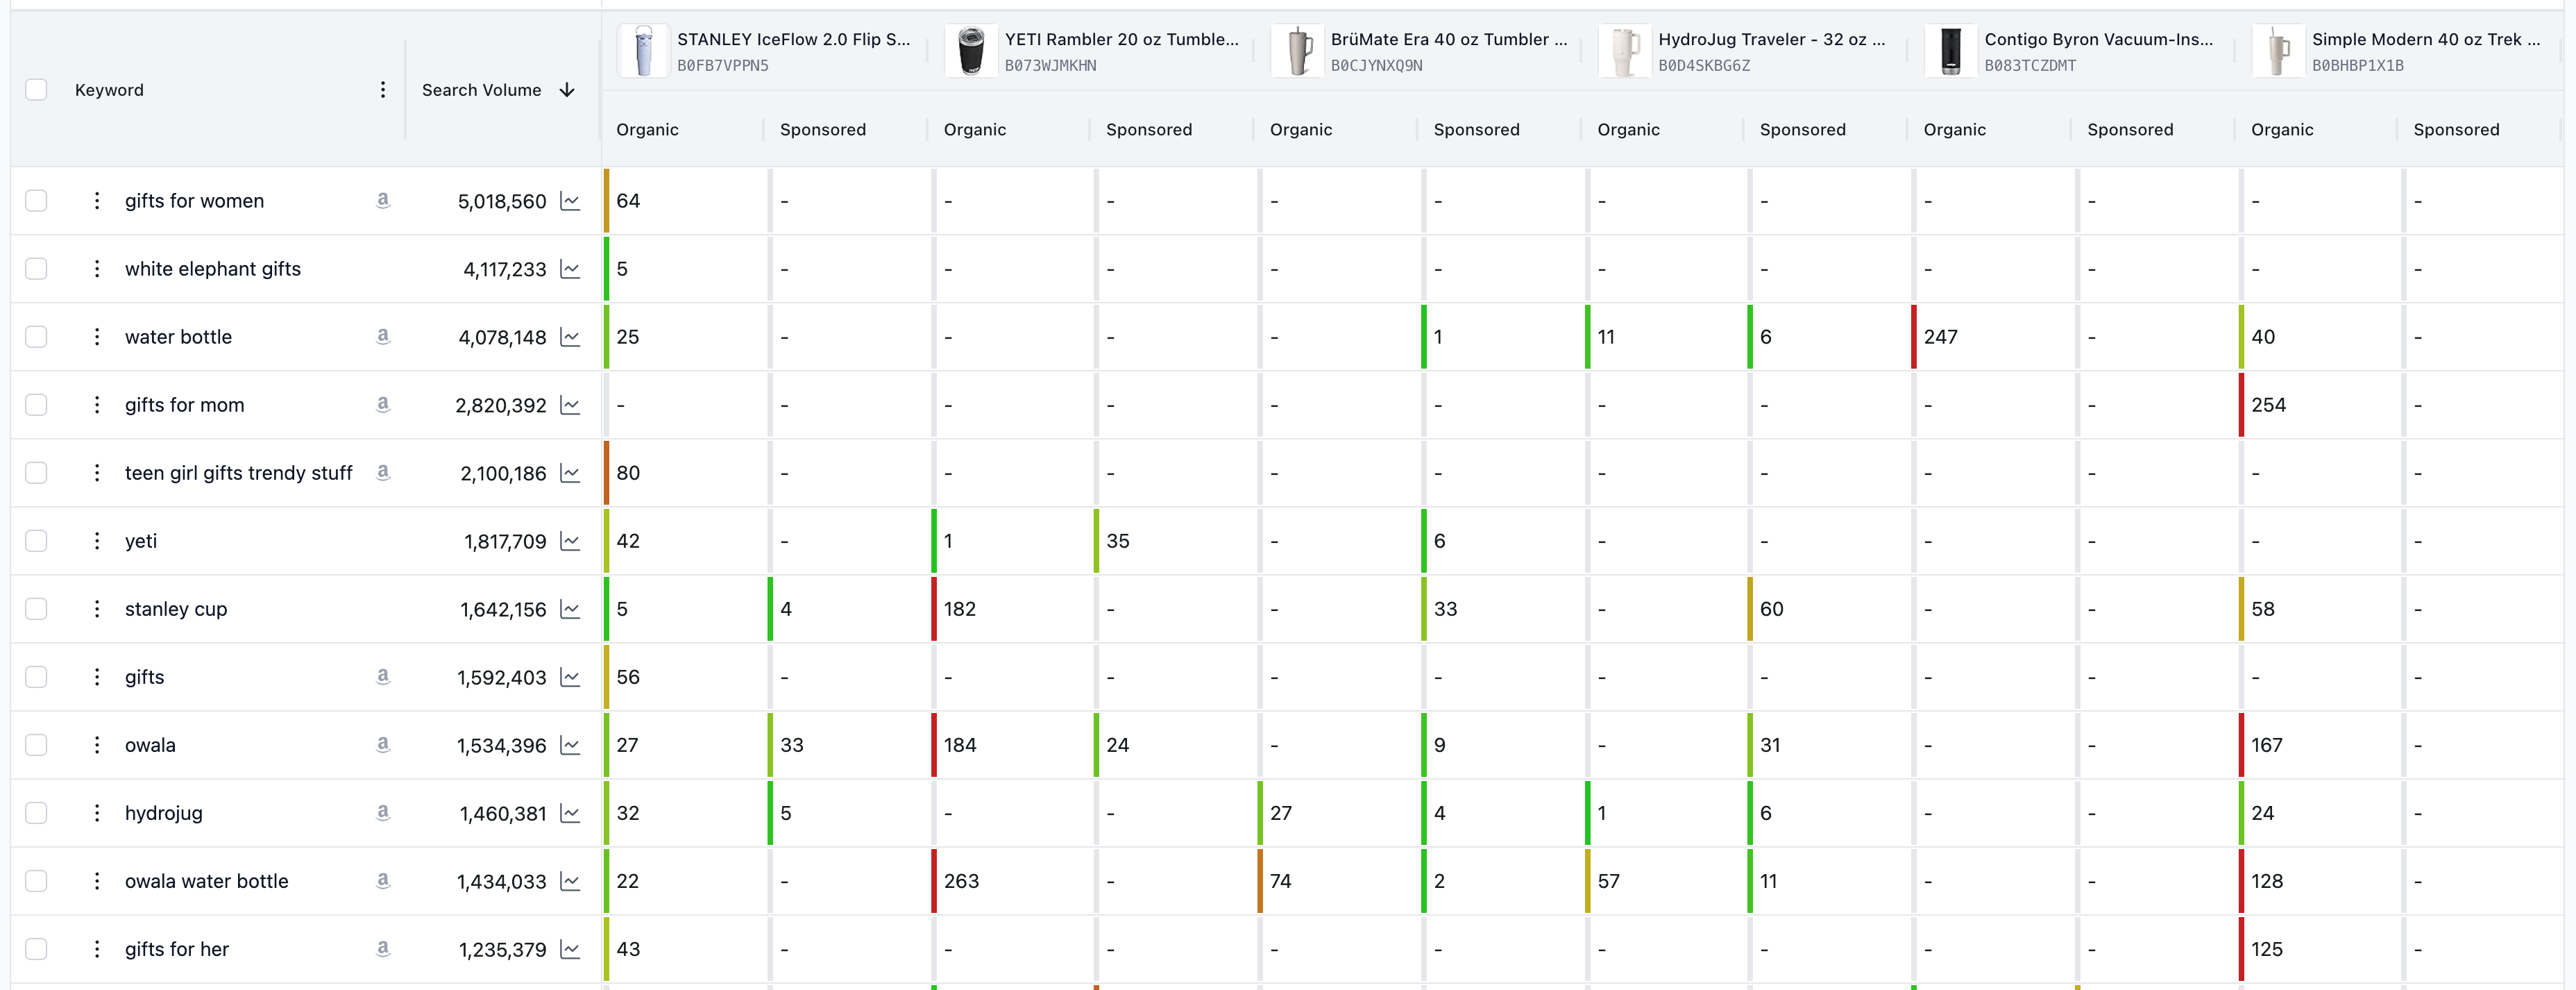
Below the attributes lies the core data: the Keyword Matrix.
Rows: The keywords (sorted by Search Volume).
Columns: Each competitor product.
Cells: The specific ranking position for that product/keyword combination.
Organic vs. Sponsored Split
Unlike standard tools that mix data, SoldScope splits every competitor column into two sub-columns:
Organic: The natural ranking position (e.g., "5" means they are the 5th result).
Sponsored: The ad position (e.g., "35" means their ad appears in the 35th slot).
This reveals their strategy instantly. If a competitor has a dash "–" in Organic but a number in Sponsored, they are paying to be seen because they don't rank naturally.
3. Visual Heatmap (Color Coding)
You don't need to read every number. The Matrix uses color-coded bars next to the rank to help you scan fast:
Green Line: High ranking (Top positions). The product is dominating this keyword.
Red Line / No Line: Low ranking or not indexed.
4. Strategy: How to use this view?
Gap Analysis: Look for rows where competitors have Green lines (high rank), and you have a dash "–" (not ranked). These are your missed opportunities.
Ad War Check: Look at the Sponsored columns. Who is bidding aggressively on the high-volume keywords?
Price vs. Rank: Compare the Price row with the Organic rank. Are cheaper products ranking higher, or is a premium competitor winning despite the high price?
Summary
Use Keyword Table View to build your list, and Matrix View to understand the battlefield.