How Buy Box Map Tool Works

Olivia Reyes
Buy Box Map is a geographic analysis tool that shows how the Amazon Buy Box is distributed across regions for a specific ASIN, along with delivery speed and pricing data.
The tool helps sellers understand where their offer appears in the Buy Box, who competes with them in different regions, and how delivery speed and price affect Buy Box visibility.
Step 1: Enter an ASIN and Start the Analysis
To begin, select a marketplace and enter an ASIN in the search field. Once submitted, the tool collects Buy Box, pricing, and delivery data for the selected product.
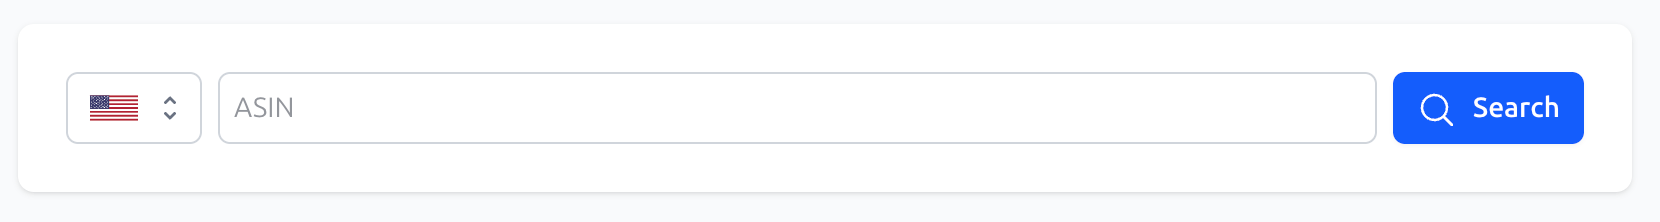
Each search represents a snapshot of Buy Box distribution at the time of analysis.
Step 2: Product Overview and Map View
After the analysis is complete, the main screen displays the product overview along with the Buy Box Map.
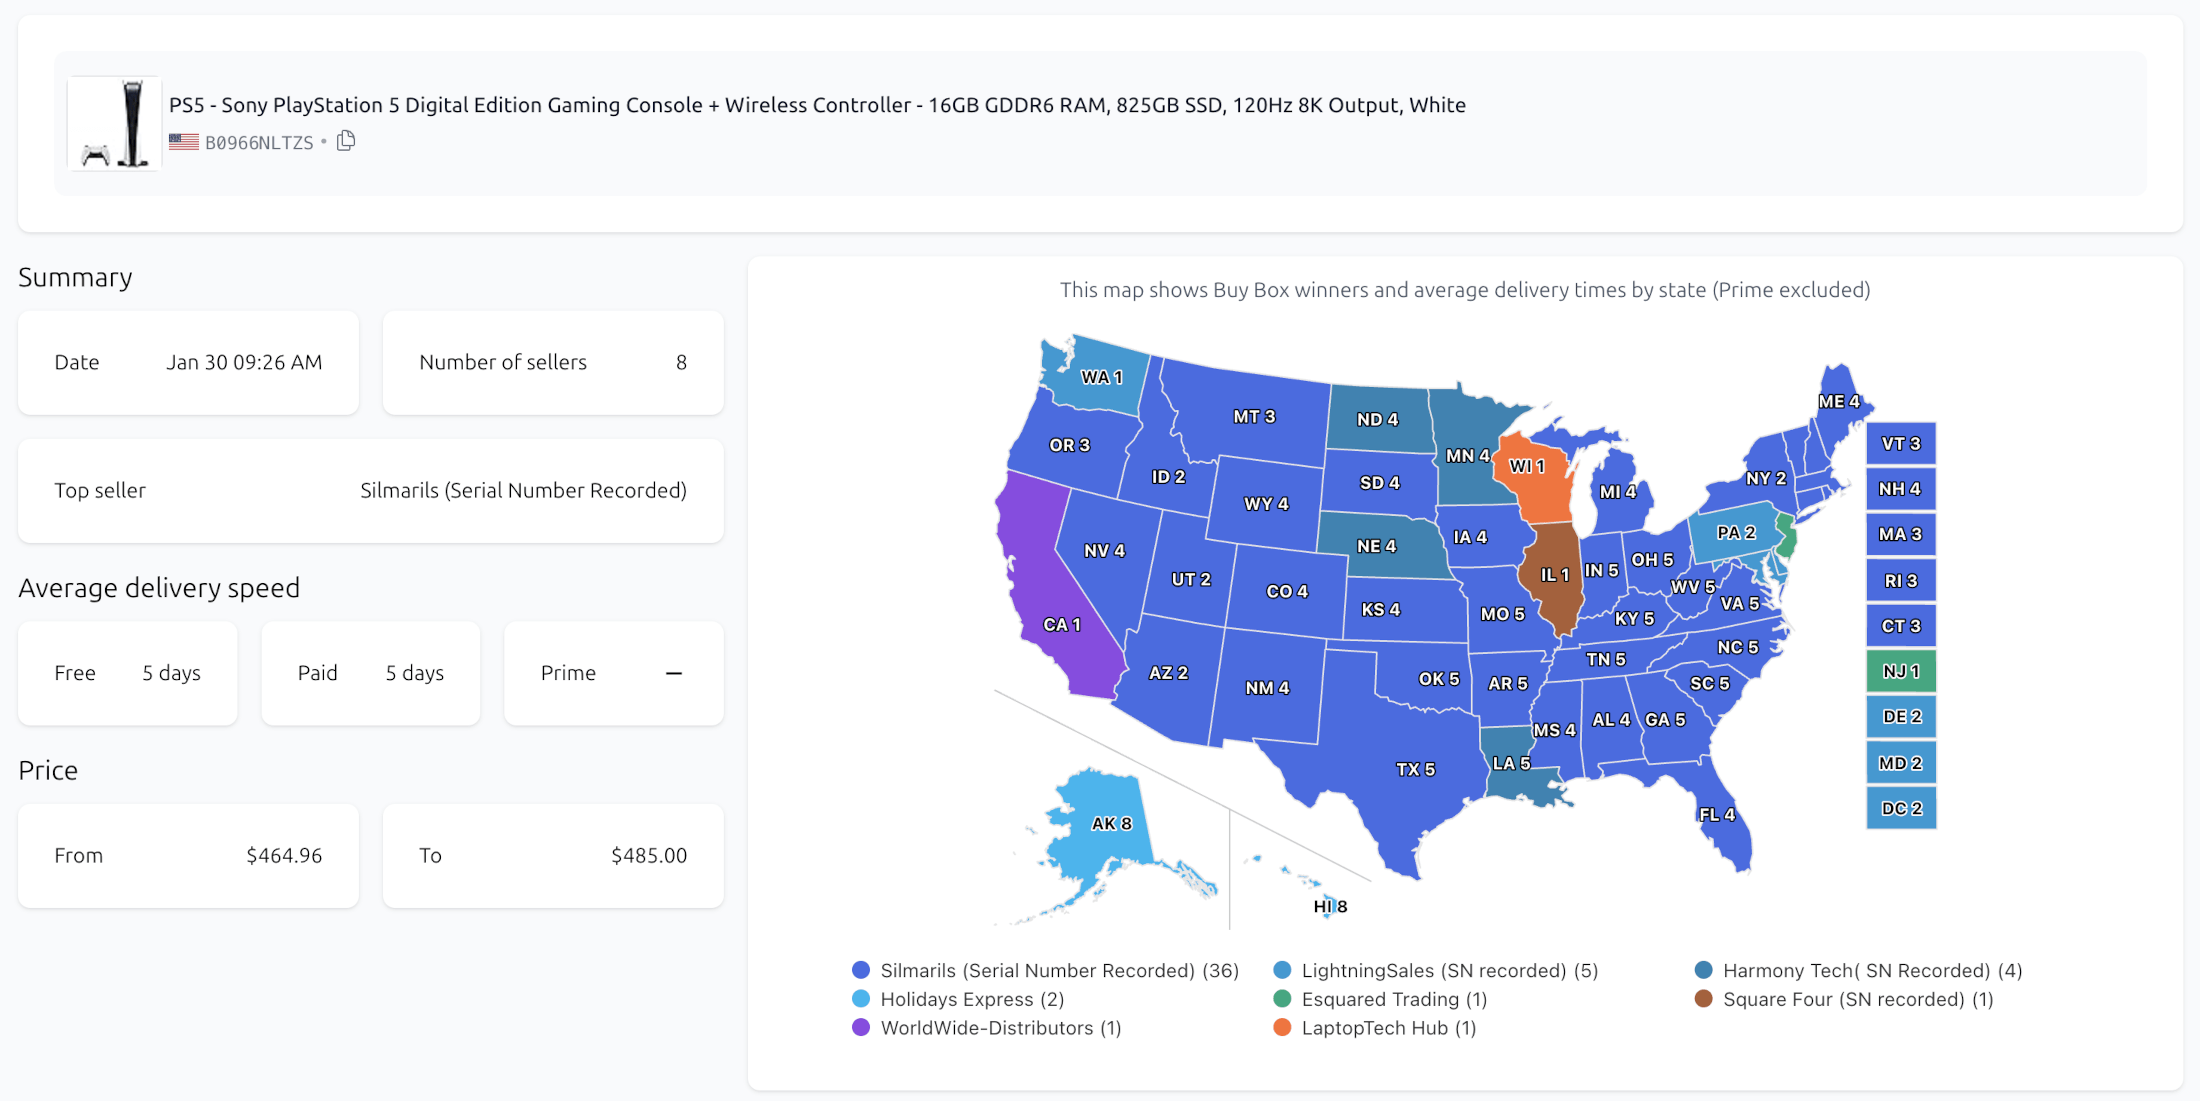
The map provides a high-level view of how the Buy Box is distributed across regions and how fast the product is delivered to customers in each location.
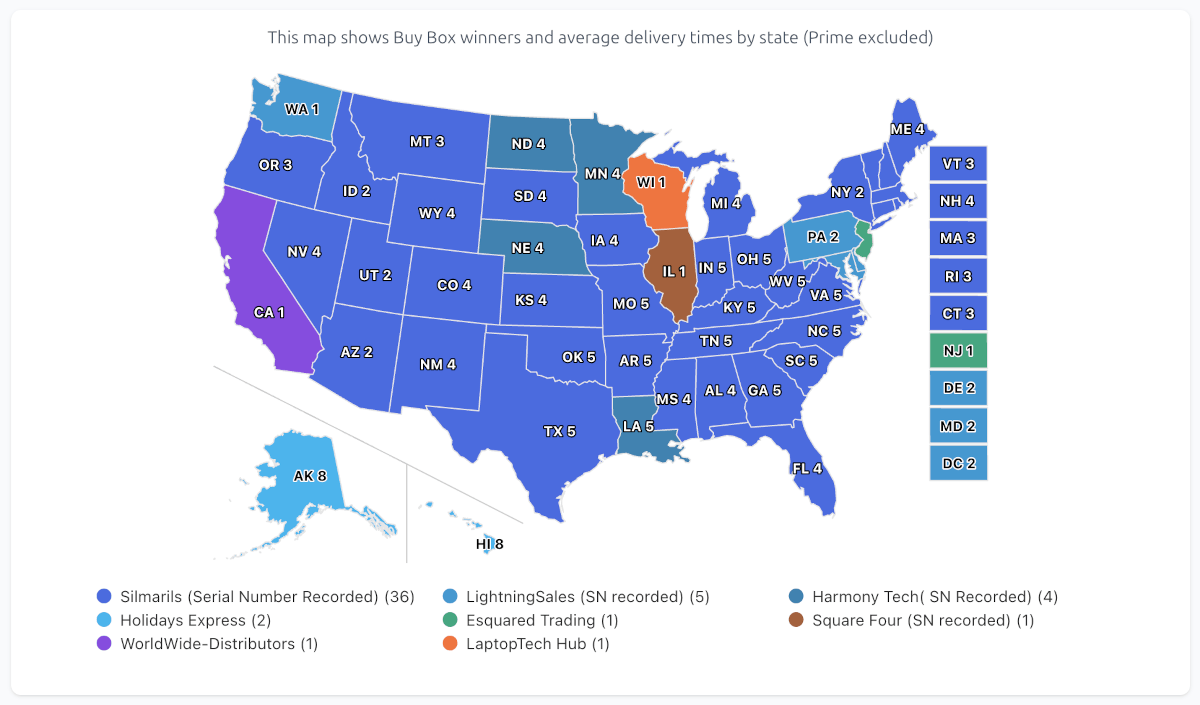
How to Read the Buy Box Map
Each region on the map is colored based on the seller currently holding the Buy Box in that region.
Color represents the Buy Box seller
Number inside the region shows the average delivery time in days
Prime delivery is excluded from the map
The delivery time shown on the map is calculated as the average between free and paid shipping options, providing a balanced view of non-Prime delivery performance.
This allows you to quickly identify regions where delivery speed or seller presence differs significantly.
Seller Distribution and Legend
Below the map, the legend lists all sellers holding the Buy Box, along with the number of regions where each seller appears.
This makes it easy to see which sellers dominate geographically and which ones have limited regional coverage.
Summary Section Explained
The Summary section provides key metrics for the analyzed ASIN.
It includes:
Analysis date - when the data was collected
Number of sellers - sellers appearing in the Buy Box across regions
Top seller - the seller holding the Buy Box in the largest number of regions
Average delivery speed - shown separately for free and paid shipping
Price range - minimum and maximum Buy Box prices observed
This section helps you quickly understand the overall competitive landscape for the product.
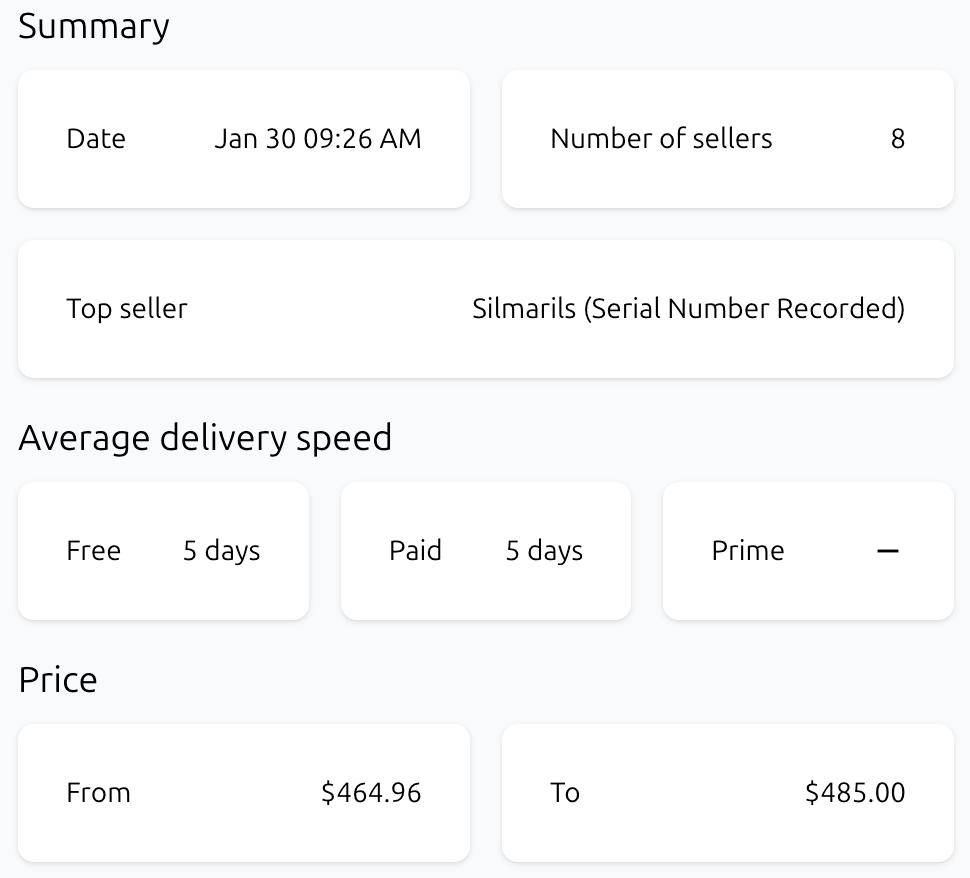
Table View: Detailed Regional Data
The table provides a detailed, region-by-region breakdown of Buy Box data.
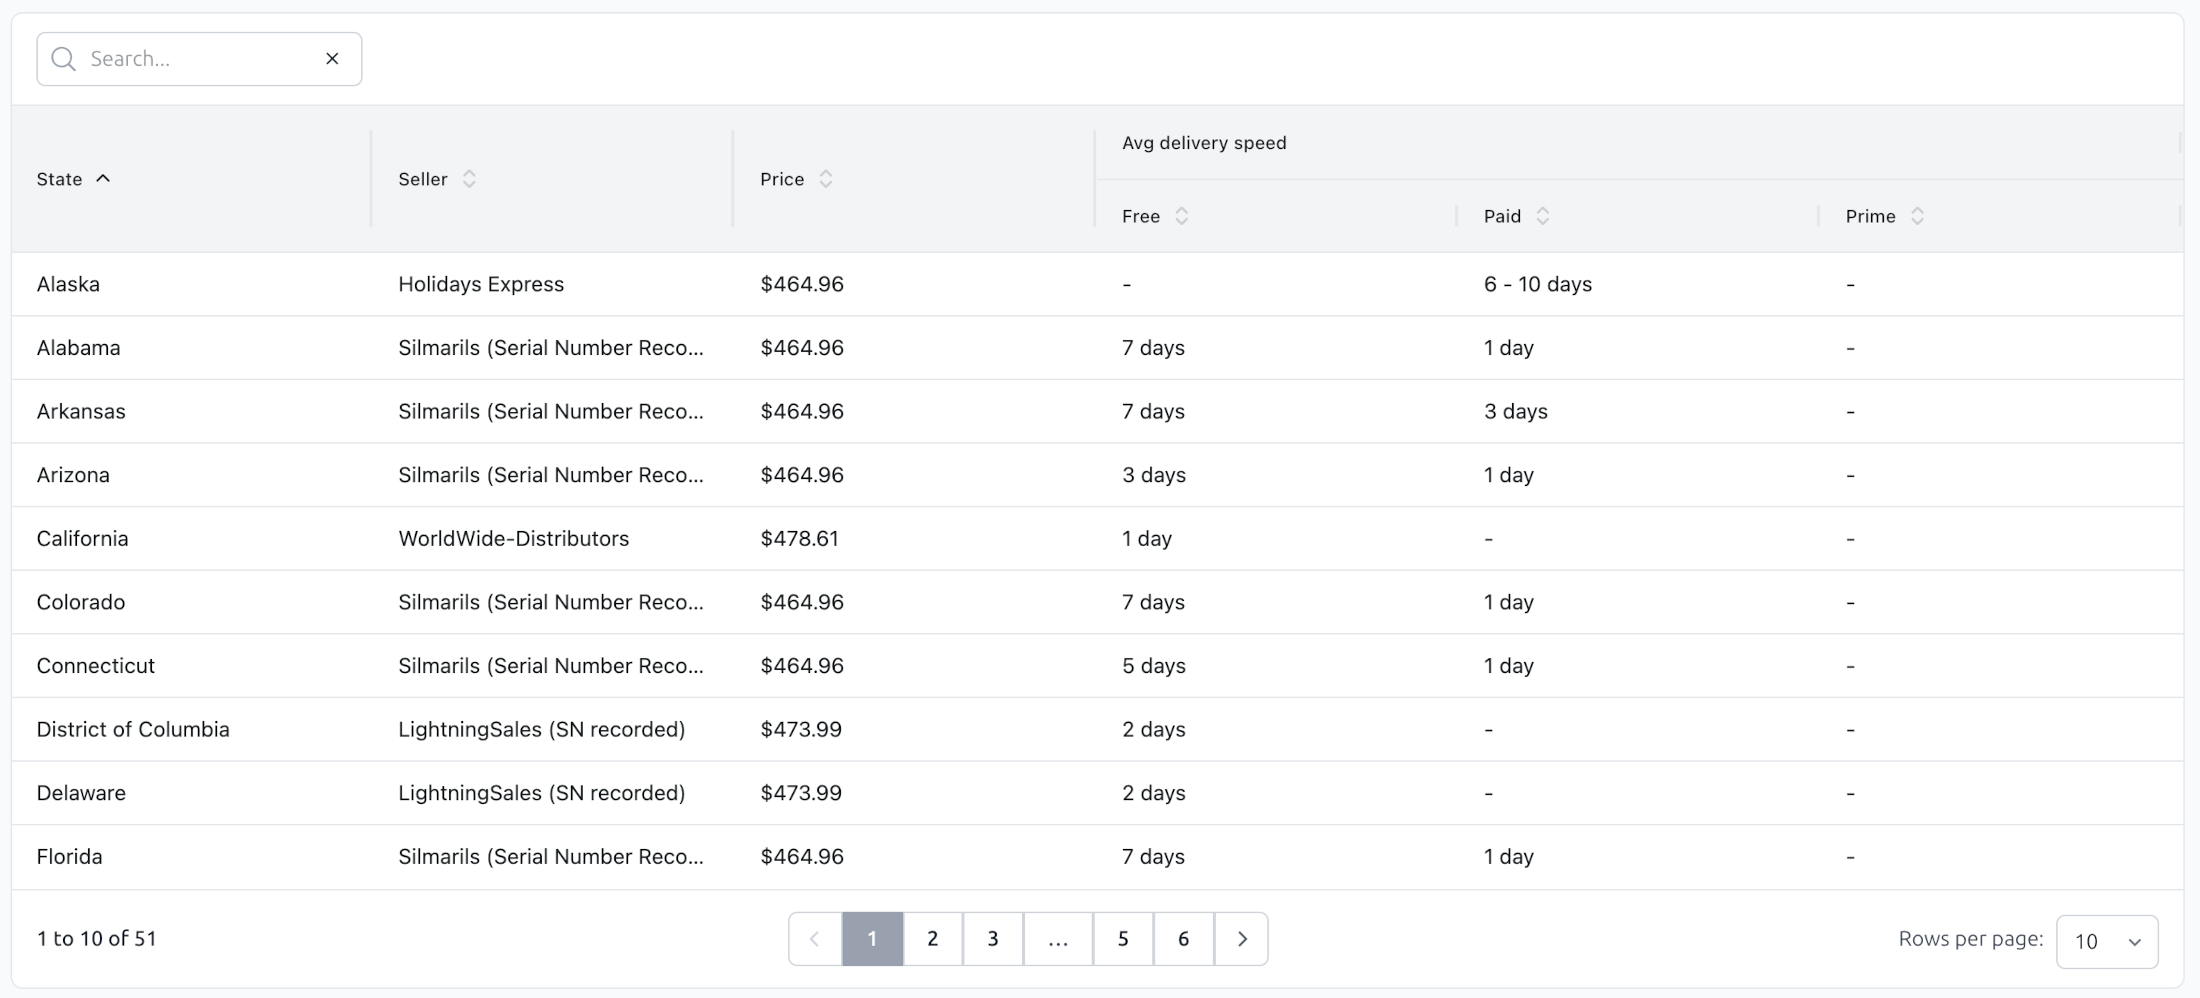
For each region, the table shows:
Buy Box seller
Buy Box price
Delivery speed for free, paid, and Prime shipping options
Delivery speeds may be shown as exact values or ranges, depending on the available shipping options for that region.
Filtering and Sorting Results
To make analysis easier, the table supports multiple interaction options:
Filter results by region
Filter results by seller
Sort by any column, including price and delivery speed
This allows you to quickly answer questions such as:
Where does a specific seller hold the Buy Box?
Which regions have the slowest delivery?
How price varies across regions for the same ASIN
Map vs. Table: When to Use Each
Use the map for a fast, visual understanding of Buy Box distribution and delivery speed patterns.
Use the table for precise comparisons, filtering, and region-level analysis.
Together, they provide both high-level insight and detailed data for informed decision-making.
Final Notes
Buy Box Map is designed to reveal geographic differences that are not visible when viewing Amazon from a single location. By combining Buy Box ownership, delivery speed, and pricing data, the tool helps sellers better understand how their offers perform across regions.