Amazon Search Query Performance, Decoded
Turn Amazon Brand Analytics data into actionable insights. Compare your market share against competitors, integrate your PPC performance, and find exactly where to grow.
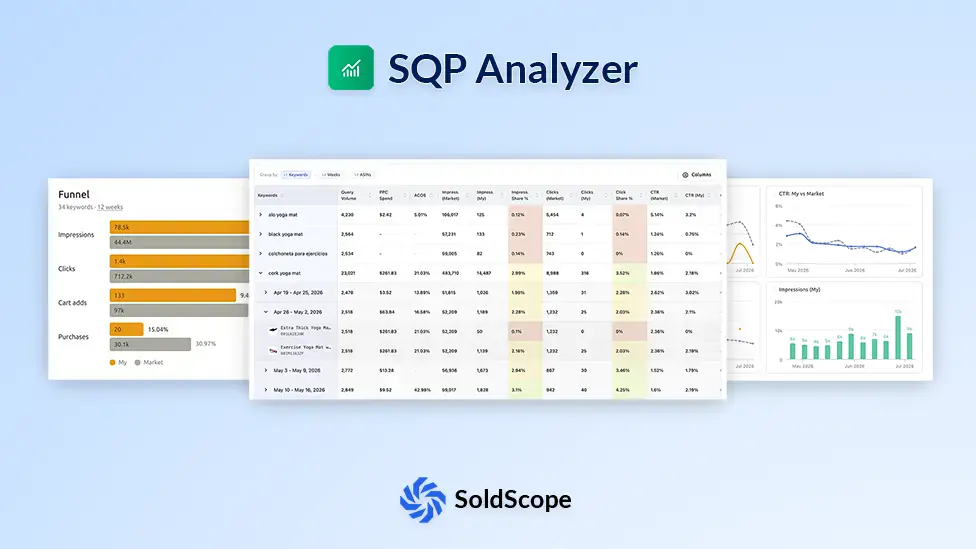
Complete Search Query Intelligence
Everything you need to analyze, visualize, and act on your Amazon Search Query Performance data
Official Amazon SQP Data
Pull real first-party metrics directly from Amazon Brand Analytics via the SP-API - no estimates, just actual data.
PPC Data Integration
Connect Amazon Ads to combine organic and paid performance, showing how your PPC spend shapes your market share.
Custom Chart Dashboards
Build your own view - add, remove, drag, and resize charts to track impressions, clicks, cart adds, and purchases your way.
Multi-level Grouping Table
Group data by keyword, ASIN, and period in a nested hierarchy up to 3 levels deep for granular analysis.
Funnel Analysis
Visualize the buyer journey from impressions to purchases, comparing your conversion rates against market benchmarks.
Weekly & Monthly Views
Toggle instantly between weekly data for short-term monitoring and monthly data to spot long-term trends.
Data Transparency Notice
Group Your Data Your Way
Nest data by keyword, ASIN, and period in a hierarchy up to 3 levels deep - drill from high-level trends down to individual query performance without leaving the table.
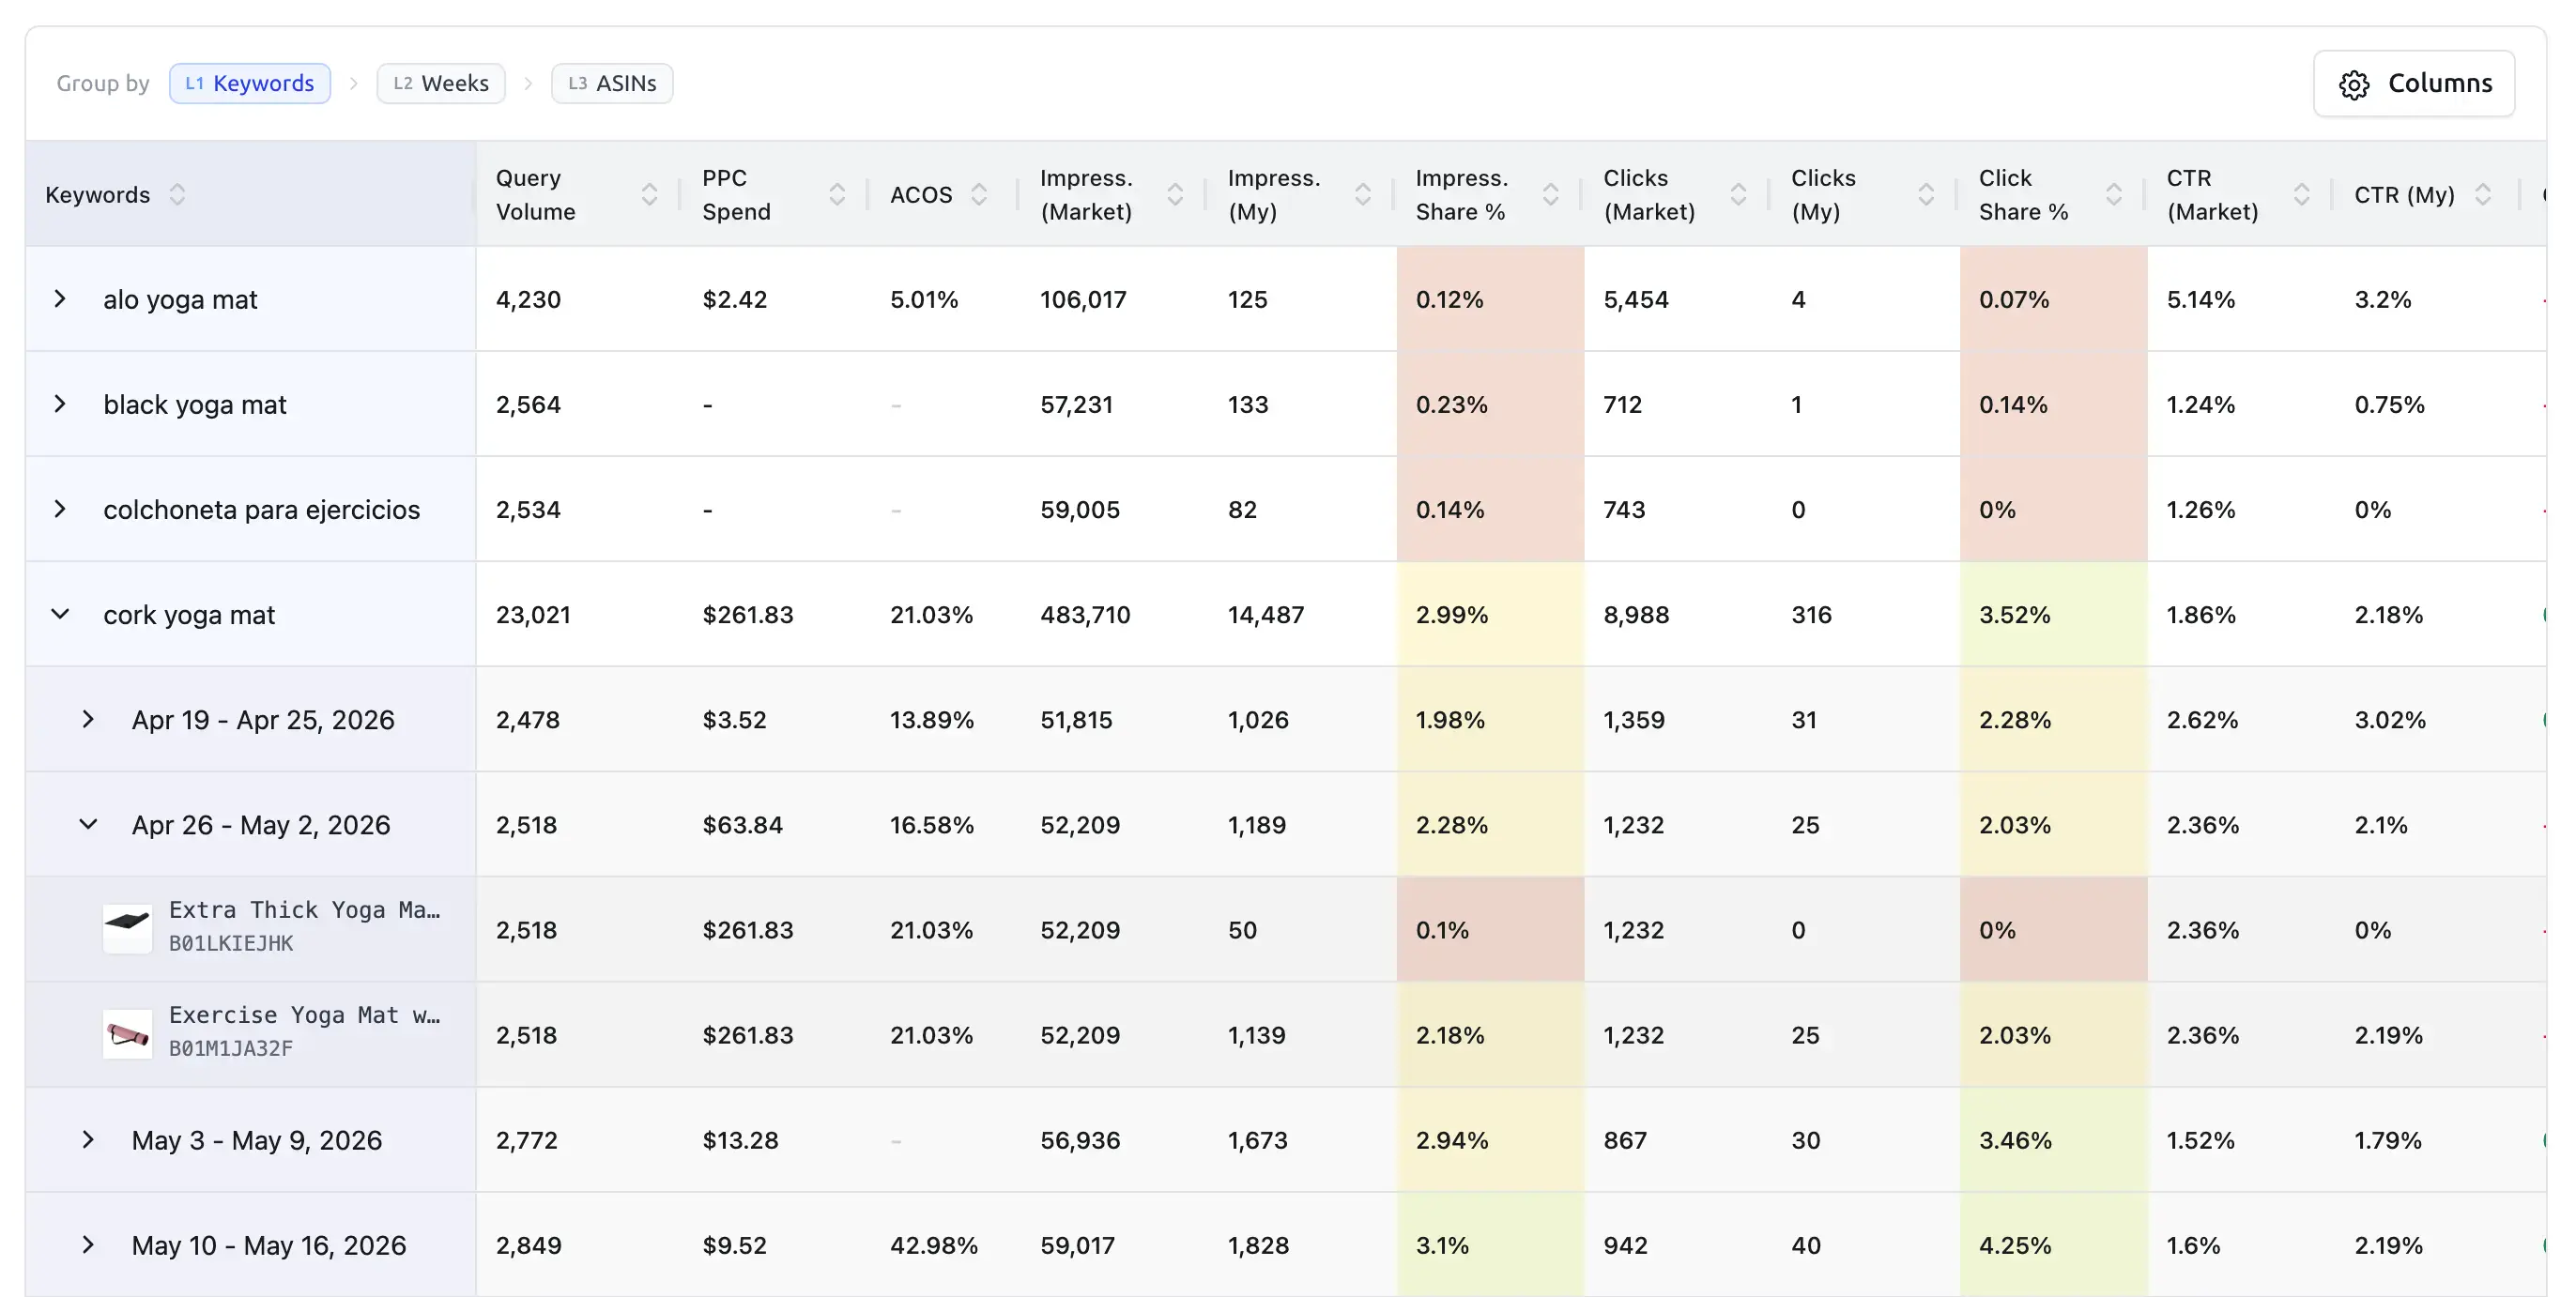
Up to 3 levels deep
Group by keyword, ASIN, and period in a nested hierarchy to go from overview to granular detail in one view.
Expand & collapse rows
Drill into the groups that matter and collapse the rest to keep your table clean and focused.
My vs Market in every row
Each row shows your metrics beside the market benchmark, so gaps are visible at every grouping level.
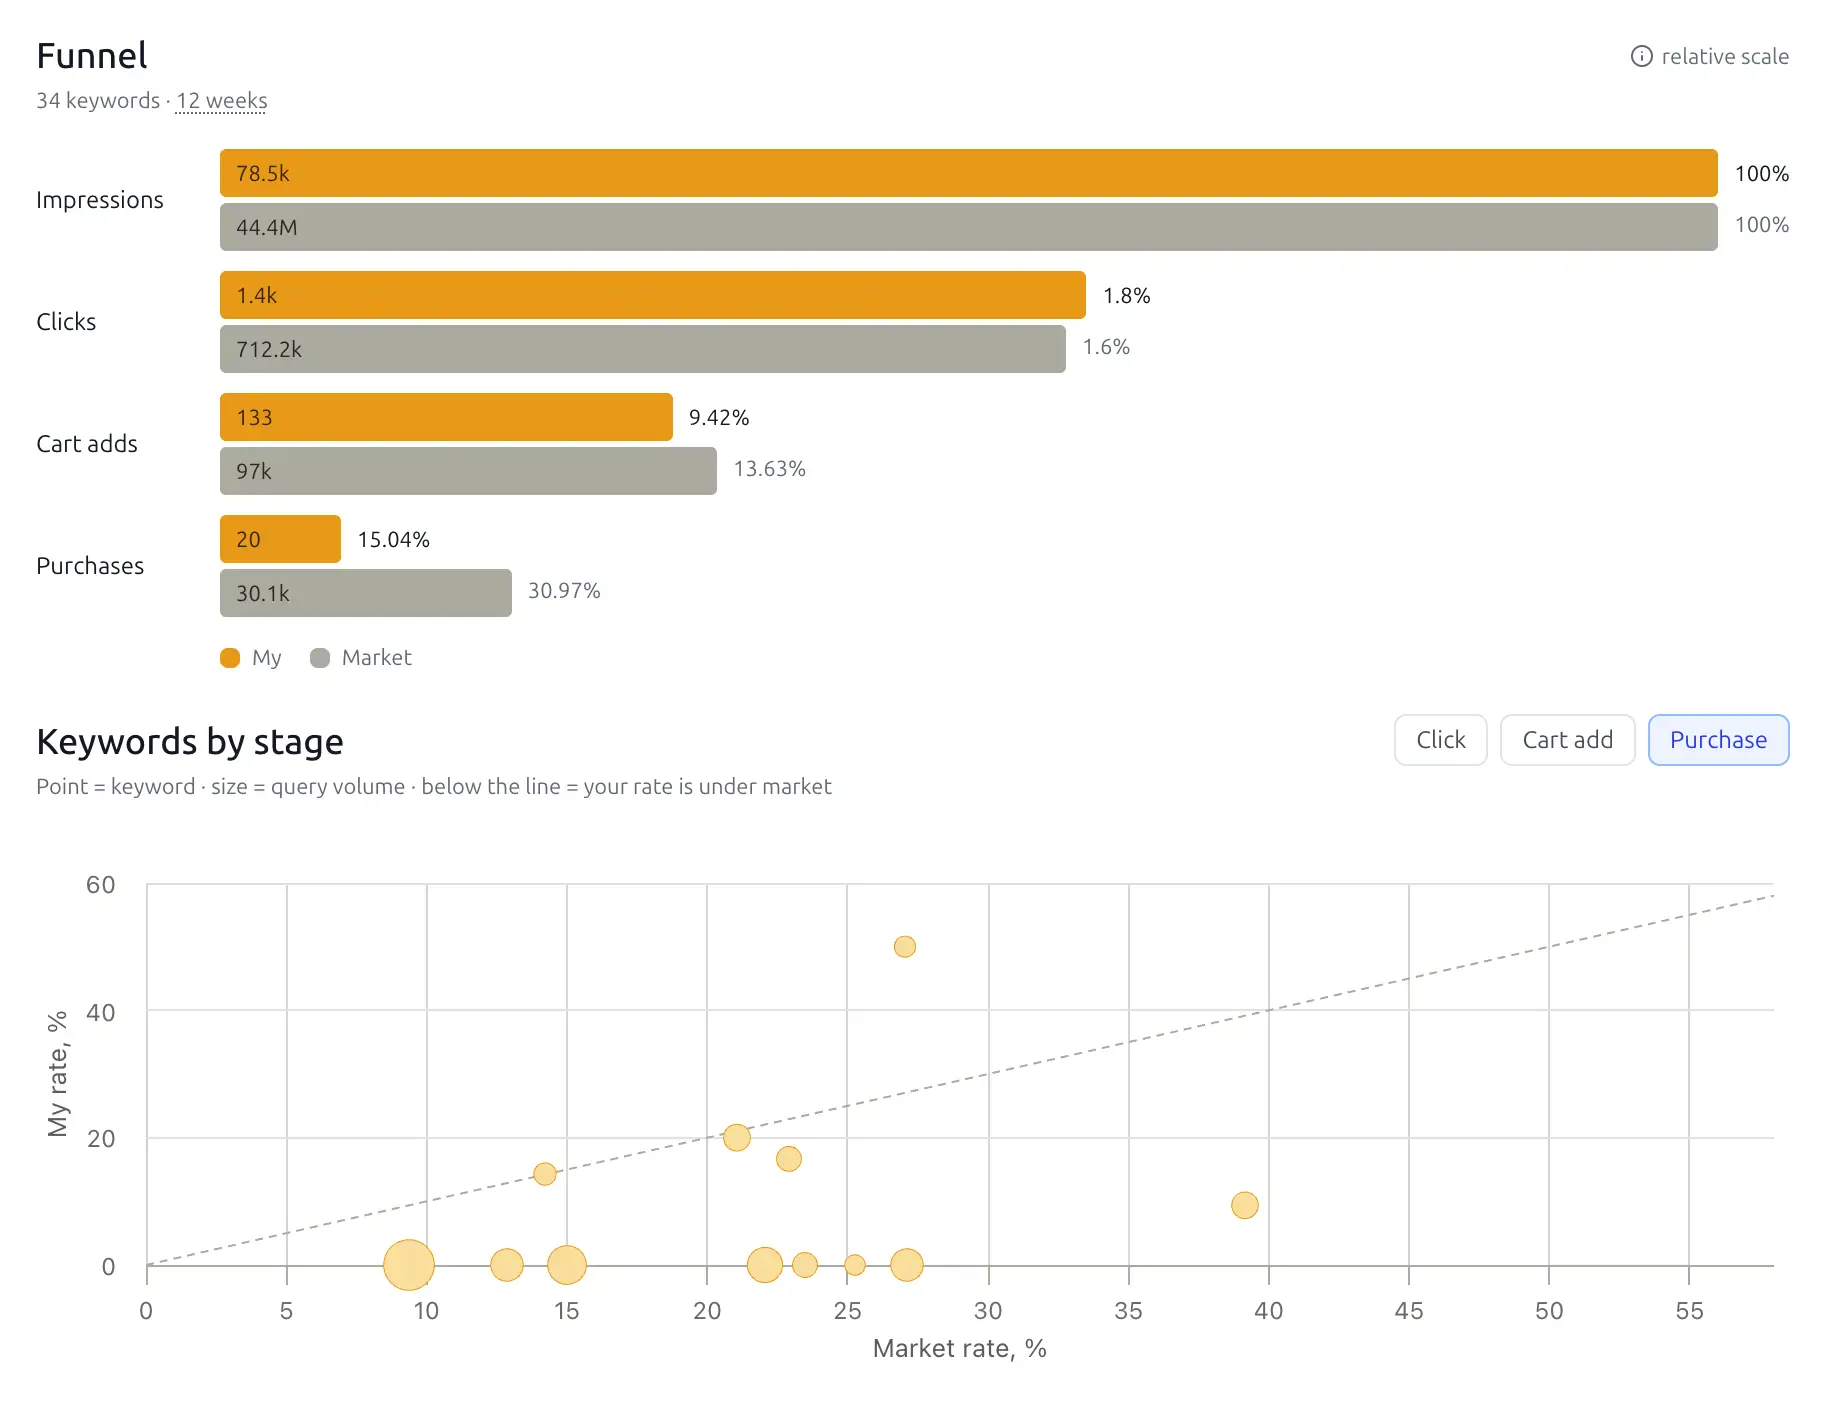
See Your Funnel, Not Just Your Numbers
Visualize the full buyer journey - from impressions to clicks, cart adds, and purchases - and compare your conversion rates against the market at every stage.
Stage-by-stage funnel
Track transition rates between each phase - cart-add rate is cart adds ÷ clicks, not ÷ impressions.
My vs Market benchmark
See your performance directly beside the market benchmark to pinpoint exactly where you fall behind.
Keyword scatter plot
Each query is plotted by your rate vs the market rate, with bubble size reflecting search volume.
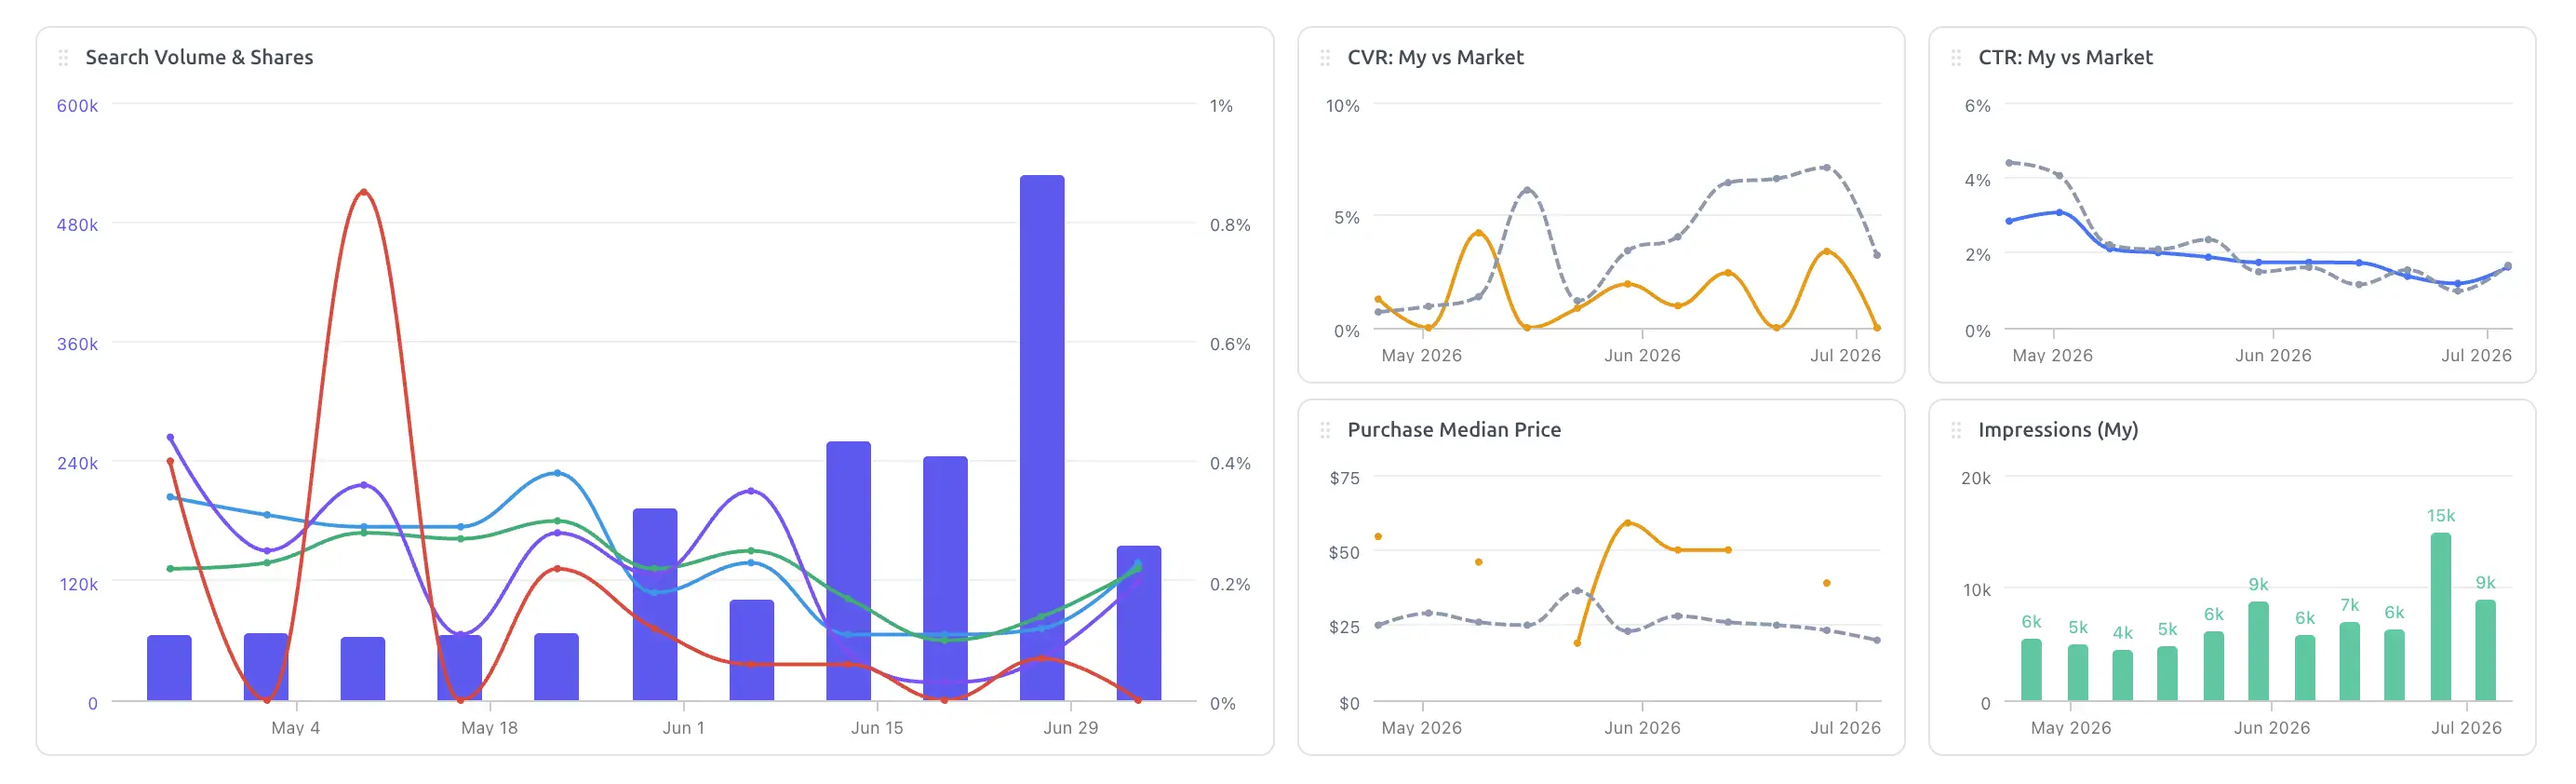
Build a Dashboard That Fits Your Workflow
Start with a starter set of charts and make it yours - add, remove, drag, and resize to track the metrics that matter to your strategy.
Drag & resize charts
Rearrange charts and change their size to create the exact view that fits how you work.
My vs Market lines
Your data line is solid, the market benchmark is dashed - the gap is your competitive position.
Reset anytime
Removed a chart by mistake? Restore the full starter dashboard with a single click.
Analyze Your Search Performance in 3 Steps
Connect Your Accounts
Link your Amazon Seller account (SP-API) and optionally Amazon Ads to unlock combined organic and PPC insights.
Select Products & Period
Choose specific ASINs, switch between weekly or monthly views, and pick the date range you want to analyze.
Analyze & Optimize
Review charts, the conversion funnel, and the grouped table to find where you lag the market and act on it.
Frequently Asked Questions
Everything you need to know about SQP Analyzer
What is the SQP Analyzer tool?
Where does the SQP data come from?
Why do I need to connect both my Amazon Seller and Amazon Ads accounts?
Can I use the tool without connecting my Amazon Ads account?
How is this different from the SQP reports in Amazon Seller Central?
We build on top of the raw reports with three key additions:
- PPC integration: see your ad spend alongside organic performance.
- Custom chart dashboards: add, remove, and resize charts to build the view that fits your workflow.
- Flexible data table: group by keyword, ASIN, and period in a nested hierarchy up to 3 levels deep.
Can I analyze my entire catalog at once, or do I have to go product by product?
Does the tool offer monthly data or only weekly?
How do I clean up the report and remove irrelevant keywords?
Ready to Decode Your Search Performance?
Start analyzing your Amazon Search Query Performance today and uncover where you can grow your market share.
Analyze Now