SQP Analyzer Overview

Olivia Reyes
The Search Query Performance (SQP) Analyzer gives you absolute clarity on your true market share. By integrating official Amazon Brand Analytics with your PPC metrics, this tool helps you understand exactly whether a drop in sales is due to your product's performance, aggressive competitors, or simply a shrinking market demand.
What Are SQP Reports?
Search Query Performance (SQP) reports are official documents provided by Amazon that offer deep insights into customer search behavior. Sourced directly from Amazon Brand Analytics, this data reveals the exact search terms shoppers use to find your products, how clicks are distributed across the market, and which keywords actually drive purchases.
⚠️ Important Requirement: To use this tool, you must connect your Amazon account to SoldScope. This allows our system to automatically pull and update these reports in the background via the official Amazon SP API.
Why Use the SoldScope SQP Analyzer?
Instead of guessing why conversions are fluctuating, the SQP Analyzer provides the context of the total market size. You can easily see if your share dropped while the market stayed stable, or if both your share and overall demand declined simultaneously.
While this data is available inside Amazon Seller Central, the native interface is often limited to rigid, raw data tables. SoldScope offers a completely different interpretation and significantly expands your analytical capabilities:
PPC Data Integration: We combine your organic SQP metrics with your advertising data at the ASIN level. This gives you the complete picture: you can see exactly which keywords you are winning because of ads, where your ad spend is having no impact on visibility, and how PPC influences your overall market share. (Note: Viewing these specific metrics requires an active connection to your Amazon Ads account).
Flexible Analytics & Customization: Instead of Amazon's static reports, you get a fully interactive dashboard. The ability to customize visual charts and apply deep, multi-level data grouping saves you hours of manual spreadsheet work.
Key Features & Differentiators
Feature | Description |
Weekly & Monthly Trends | Switch seamlessly between granular weekly data and broader monthly trends to identify macro shifts in market demand. |
Fully Customizable Dashboard | Tailor your workspace. Select from a variety of charts (Search Volume, CVR, Impressions, etc.), resize them, and arrange them to fit your exact workflow. |
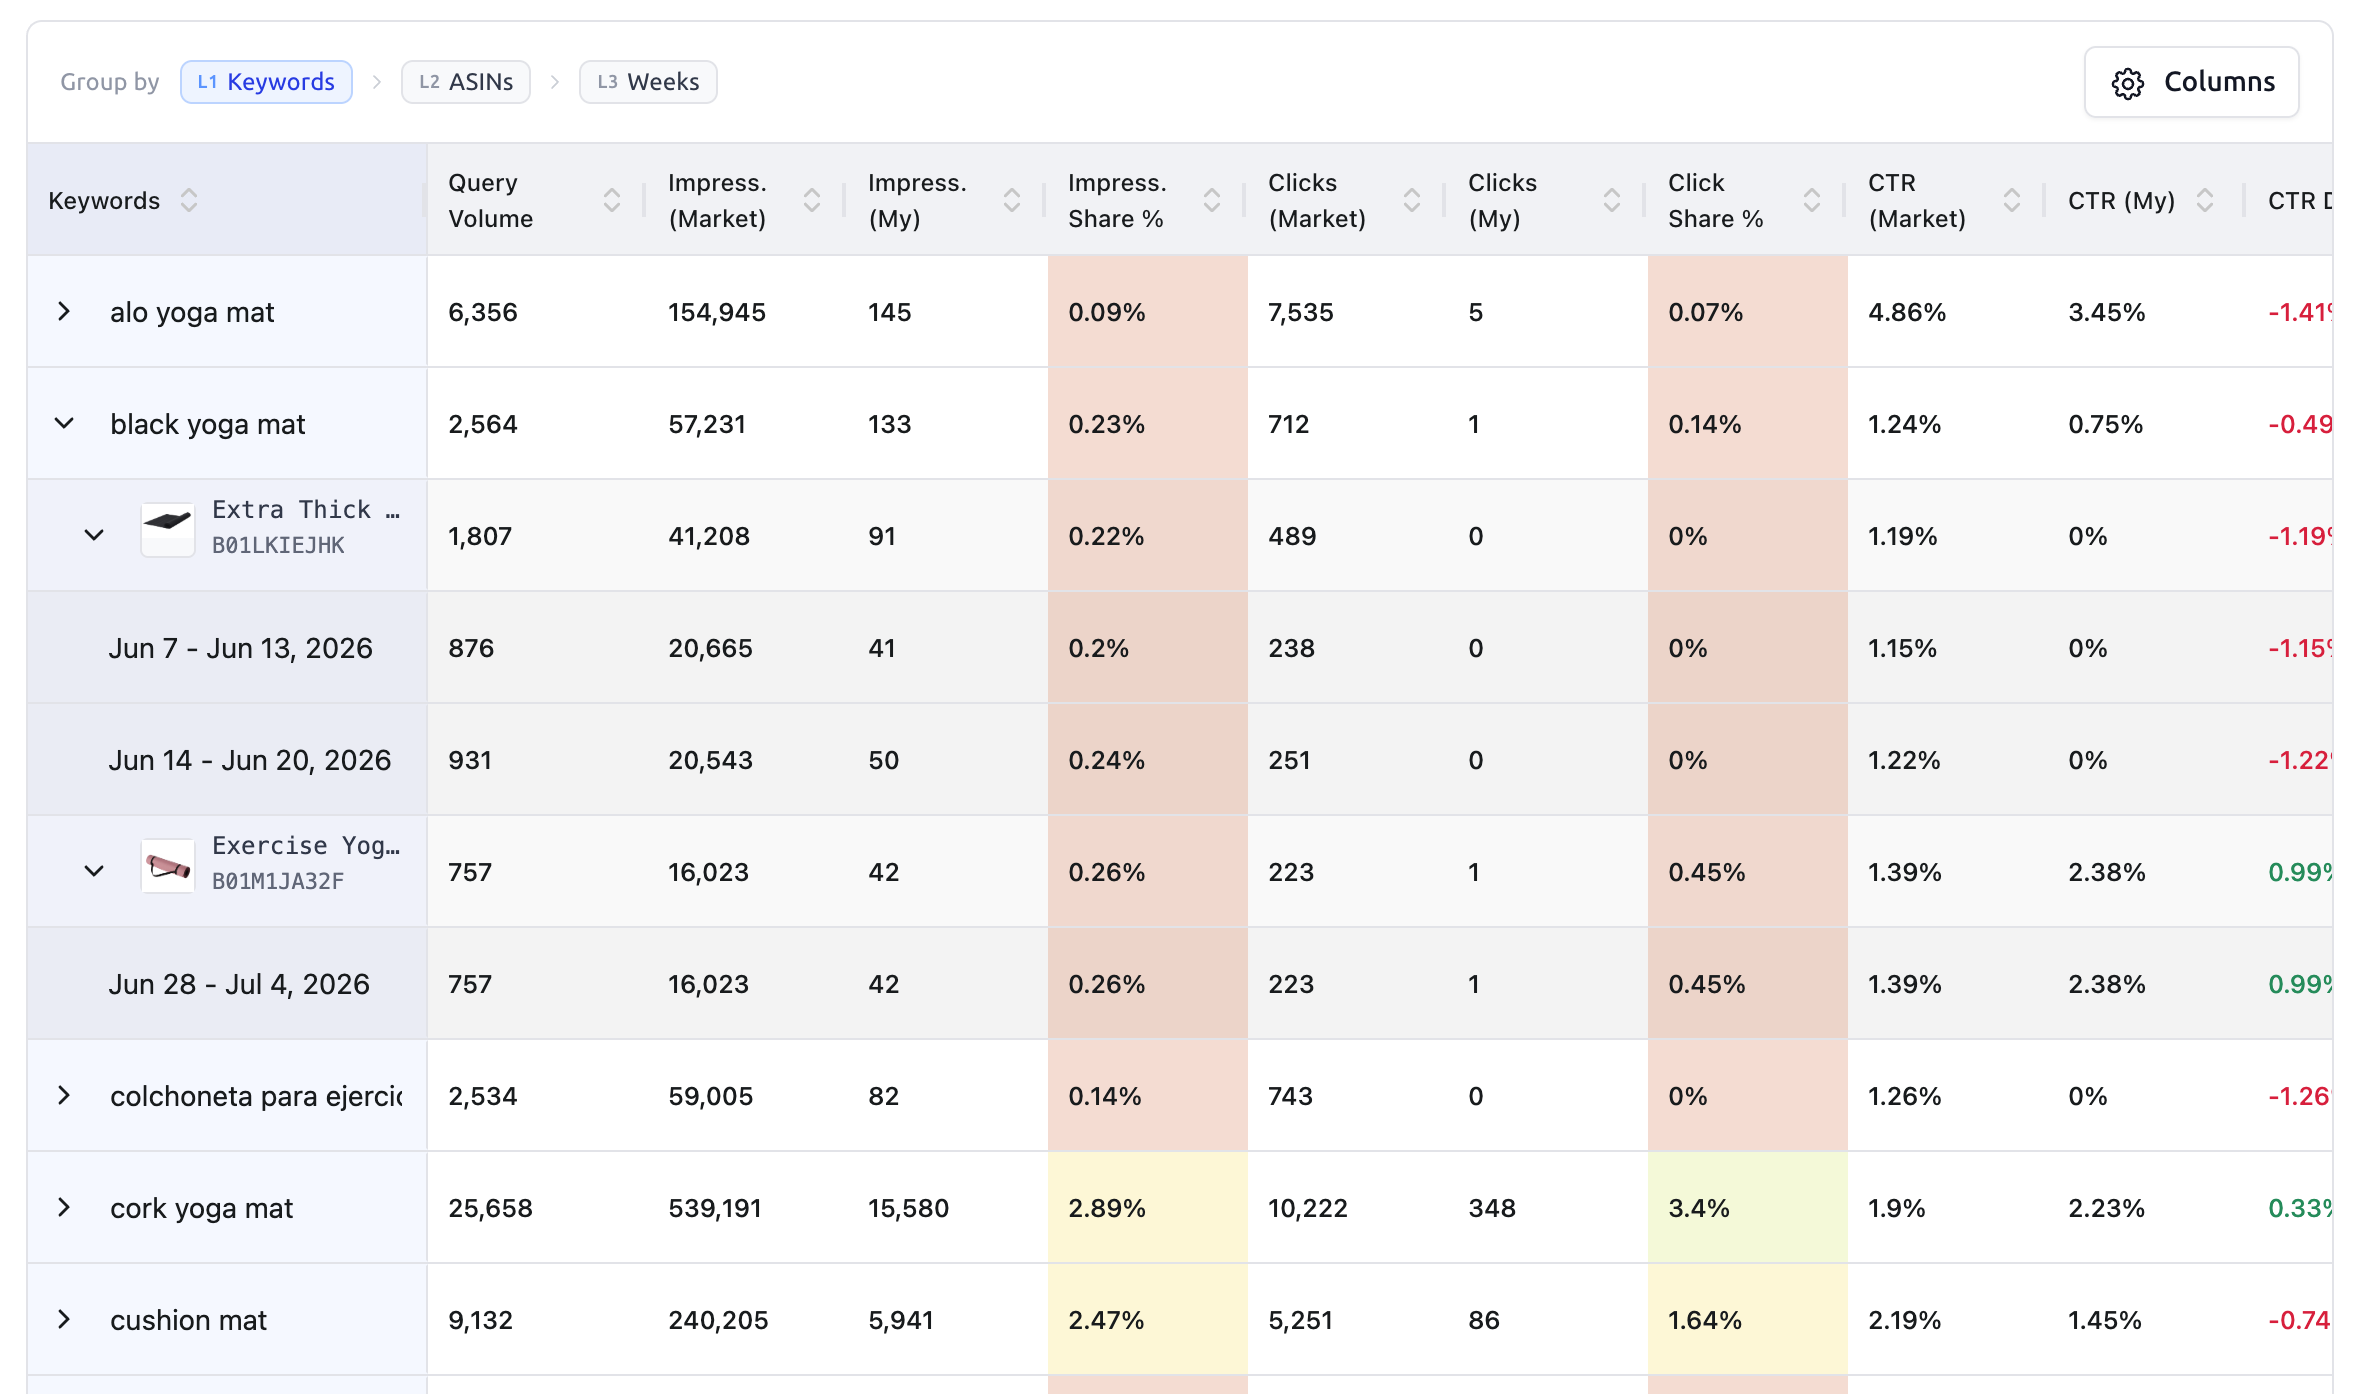
Deep Data Grouping | Organize the data table up to 3 levels deep. Group information by Keywords, ASINs, or Time Periods (Weeks/Months) in any order you choose. |
PPC Integration | View organic metrics alongside your advertising data to see which keywords your ads actually help you win and where ad spend is cannibalizing organic sales. |
Granular Filtering | Break down performance across your entire catalog at the Account, Parent ASIN, Child ASIN, or individual Keyword level. |
Selecting Your Data for Analysis
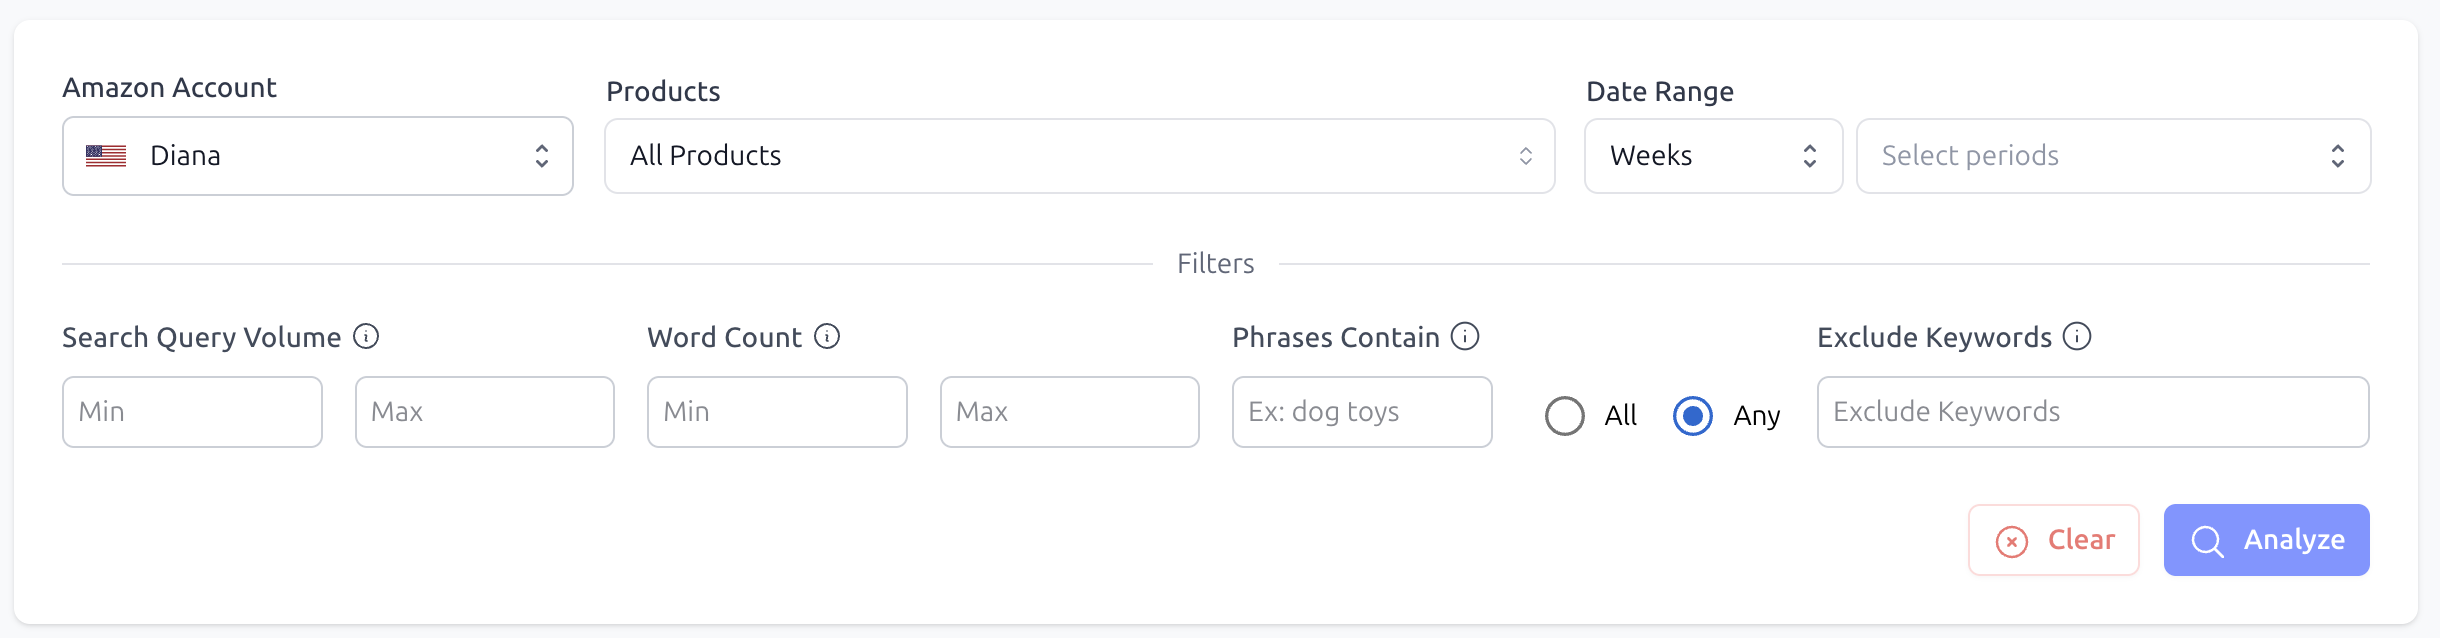
Before diving into the metrics, set your parameters to focus on the exact data you need and filter out the noise:
Set Core Parameters: Use the top bar to select your Account and Marketplace. Selecting a specific product is optional if left blank, the tool will analyze data across all products in your account.
Define the Timeframe: Switch between Weekly and Monthly views, then select your specific date range to analyze short-term fluctuations or long-term market trends.
Filter Keywords: Narrow down the search terms using filters for Search Volume, Word Count, or specific Phrase inclusions/exclusions. This removes irrelevant keywords that typically clutter standard SQP reports.
Configuring Your SQP Dashboard
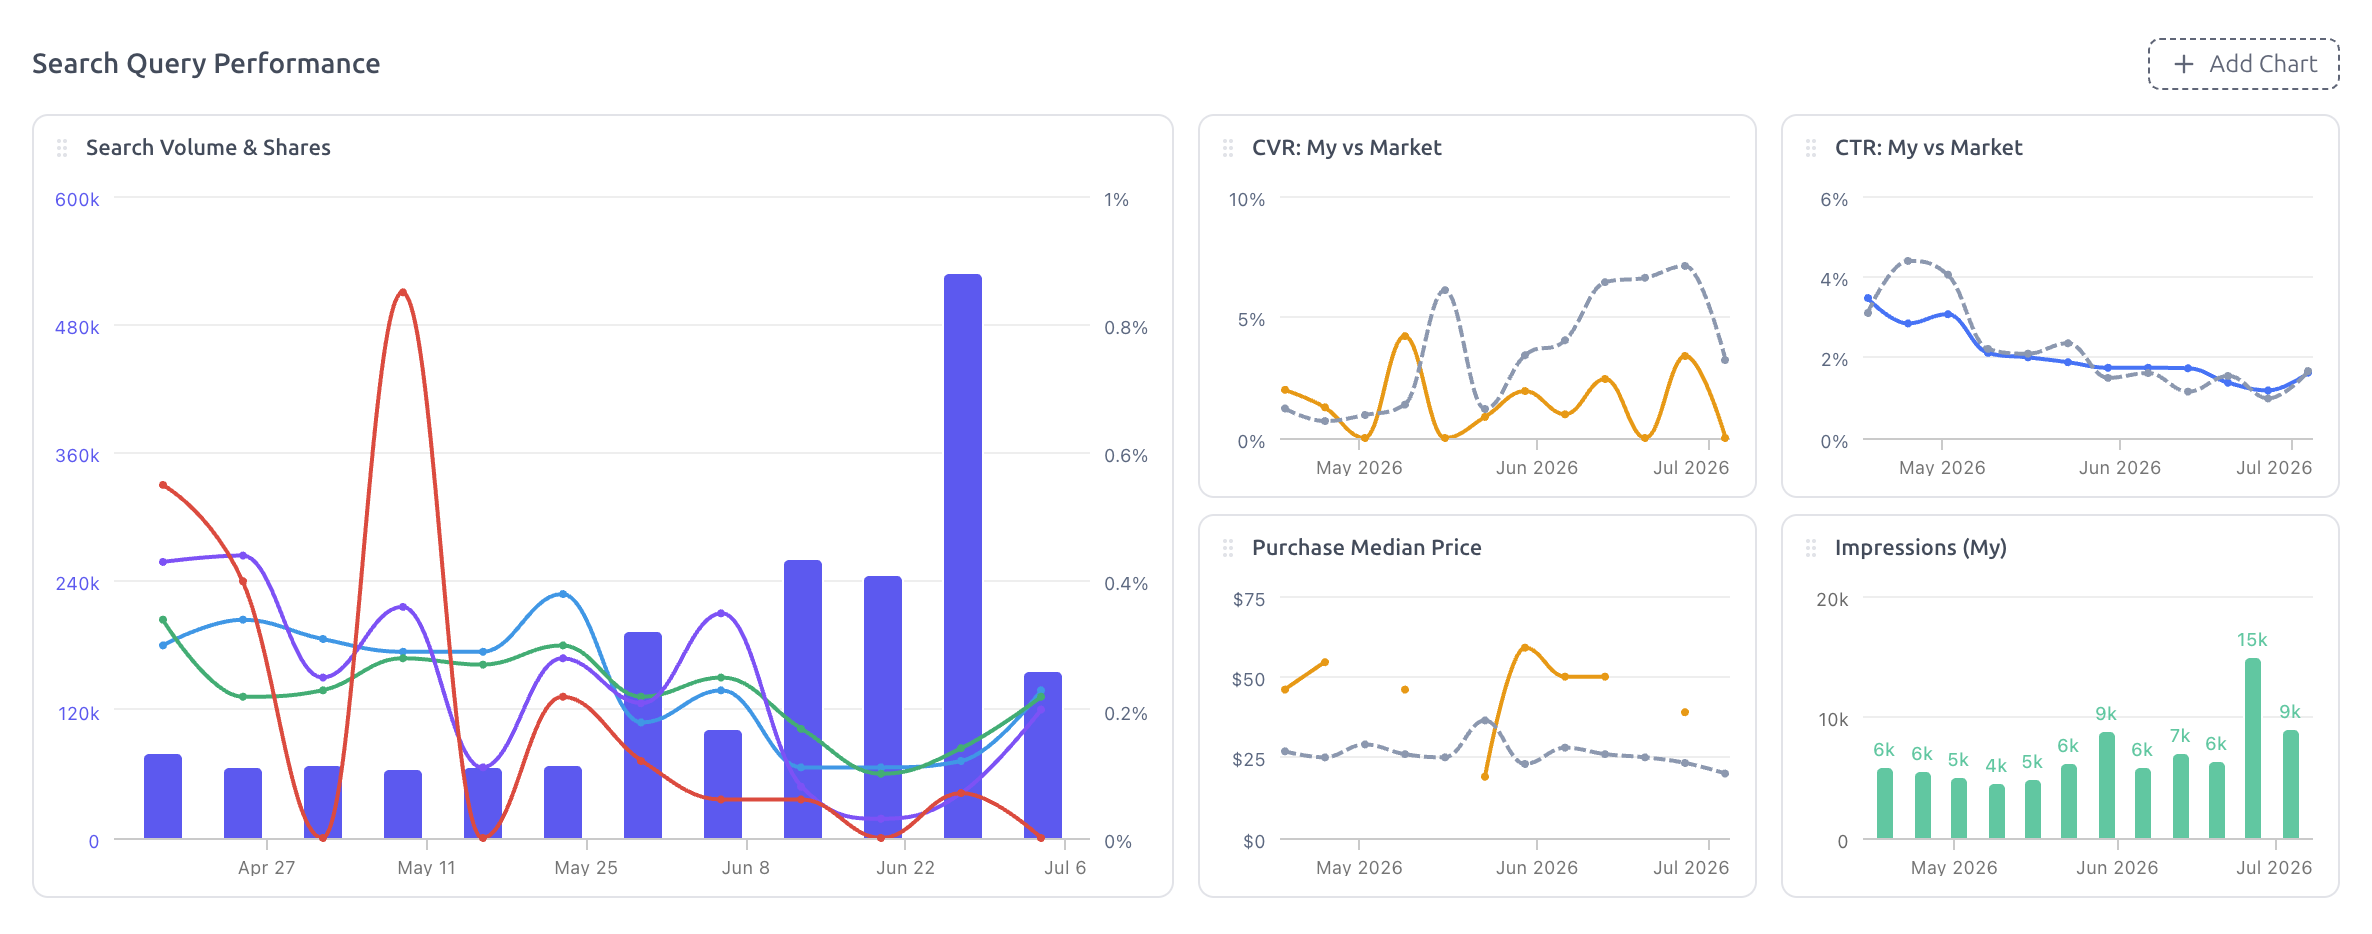
Once your data is selected, you can fully customize the interface to match your analytical workflow:
Customize Charts: Select the specific charts you want to display (e.g., Search Volume & Shares, CVR, Impressions). You can resize them and drag them into any layout to prioritize your most critical KPIs.
Apply Deep Table Grouping: Scroll down to the data table to set up your grouping hierarchy. You can group data up to 3 levels deep by combining Keywords, ASINs, and Time Periods (Weeks/Months) in any order you choose.